Gundalf Calibration data
Calibration Epoch 11-Apr-2025
Index of contents
- Notes on alternative sources
- Notes on airgun calibration
- Bolt 1500LL
- Bolt 1900LLX
- Bolt 1900LLXT
- Bolt 8500 APG
- Bolt 2800LLX (2015)
- Bolt e500, types A, B and C (2015-6)
- Bolt e300, types A, B and C (2016)
- Deep Bolt 1500LL
- Shallow Bolt 1900LLX
- Clustered 1900LLX guns
- Bolt 8500 APG highly interacting arrays
- G type I guns
- G type II guns
- Bluepulse 100Hz and 200Hz guns NEW !
- GI guns
- Deep G 150 type I gun
- Sleeve type I guns
- Sleeve type II guns
- Clustered sleeve type I guns
- High frequency calibration (far-field)
- Low frequency TPS calibration (datasheet) NEW !
- Low frequency Gemini calibration (datasheet) NEW !
- Sparker calibration (datasheet) NEW !
Notes on Alternative sources
Overview
Alternative sources were introduced into Gundalf in 1Q 2022. Currently they consist of a small number of sparker and boomer sources and a generic marine vibrator. Available calibration data for these is minimal in comparison to the mature state of measurement for airgun sources as detailed later in this document. It is currently limited to a small number of far-field signatures with which agreement is good, but the provenance of these is not well established and is comparable to the state of airgun measurement perhaps 10-15 years ago. As more data becomes available, we expect these alternative sources to slowly approach the current state of measurement in airgun sources, although it must be pointed out that the acquisition of high-quality near- and far-field signatures is an expensive business and the investment may not be available. Suffice it to say, Gundalf will track this situation as well as we are able. For now, we view calibration status for each of these sources as moderate at best, although likely to be reasonably close.
Notes on Airgun calibration
Overview
Calibration is an important issue in airgun modelling to provide confidence in the quality of the modelling results. Oakwood Computing Associates Ltd. maintain the policy of calibrating Gundalf against the best available data of quantifiable quality. In general, this is restricted to data shot in a measurement facility with calibrated phones, calm water and careful control over the positioning of the guns and the measurement hydrophones. No attempt is made to match other modelling approaches.
Calibration epochs
From time to time, Gundalf is partially re-calibrated as more and more high quality measurement data becomes available. Gundalf uses a concept borrowed from astronomy and describes re-calibration milestones as epochs. The calibration epoch for any version of Gundalf is shown in the main File -> About menu underneath the revision date and version number. Oakwood Computing Associates Ltd. also notify all users of any such changes. Recent epochs and their associated changes are described below most recent first.
-
2025-Apr-11
- All sparker modelling switched to a generic cavity modelling algorithm. This is a preliminary calibration only. No other source type is affected.
-
2025-Jan-06
- The Bluepulse sources have been added in a preliminary calibration. No other source type is affected.
-
2024-Sep-30
- The Tuned Pulse Source (TPS) and the Gemini source have been added as low-frequency sources. No other source type is affected.
-
2023-May-19
- The XLA source has been recalibrated to provide a reasonable generic match with the TPS and Gemini low frequency sources. No other source type is affected.
-
2023-Jan-31
- The algorithm calculating injector times for GI guns has been slightly modified following feedback from Sercel. This may cause a slight change in P2B and period but no change in P2P for some previous configurations. In addition, Gundalf will only model the advertised Gun volumes, which are currently 30, 40, 50, 60, 90, 150, 210, 255 and 355 cuin (Harmonic mode) and 45, 150 (True GI mode). Gundalf will continue to model any gun volume within legitimate ranges for the "None" mode. We are grateful to Sercel for this feedback. Calibration of any other gun types in Gundalf is unaffected by this change.
-
2022-Sep-30
- An experimental calibration of the JA76 airgun produced by Seismic Source Engineering LLP was introduced. This gun is very similar to a Bolt 1900LLXT in calibration terms. Calibration of any existing gun types in Gundalf is unaffected by this introduction.
-
2020-Jun-30
- An experimental calibration of a very large airgun has been included (XLA). This has been calibrated only from published signature parameters of various large volume deployments and is intended at this stage only for exploring the low-frequency possibilities of such sources. It is not intended to represent any particular gun type.
-
2020-Jan-12
- Sercel G-GunII guns were revisited using more calibration data to centre the calibration envelopes. This will affect both single guns and clusters but will not affect any other gun type. The primary to bubble fit is now more balanced across the full range of volumes.
-
2018-Mar-30
- The Bolt 1500LL guns were re-calibrated slightly for very large guns due to an inconsistency in one of the three independent sources of data we use for this gun compared with the other two. Since the inconsistent dataset was an older dataset, its relevance was downgraded and preference given to the more modern datasets. No difference will be observed for guns smaller than 400 cuin., but larger guns will show an effect.
-
2017-Aug-10
- The Bolt 1500LL and 2900LLX/T guns were recalibrated to slow the rise time based on new high-frequency datasets. This affects the zero to peak values by +/- 2% compared with previous calibration datasets which were dominated by lower-frequencies.
-
2016-Apr-18
- The Bolt e300 is included for the first time. In addition, small changes made to cluster damping physics (typically around 1-2% on periods of highly-interacting clusters.
-
2015-Oct-30
- Small correction to previous calibration for eSourceB guns, which were underpredicted for non-recorded sample intervals.
-
2015-Aug-09
- Following advice from the supplier that the original eSource hydrophones had been re-calibrated, this has been applied to the eSource modelling for all types. This leads to an increase of some 8-9% in the zero to peak value for these guns.
-
2015-May-01
- Re-calibration based on new datasets for G-GunII, eSource and 2800LLX. Further changes may follow as the new datasets are gradually assimilated.
-
2015-Jan-07
- A preliminary calibration of the new Bolt eSource is included for the first time. We are still processing data on this new gun type so it is expected that the calibration will be refined through the next weeks and months as is the case with all new technology. Other gun types may have been affected slightly as calibration was generally reviewed given the increasing amount of high quality data displacing older and less well curated datasets.
-
2012-Oct-12
- The calibration has been changed very slightly and indirectly by the resolution of a defect in the gun delay logic. This has no effect whatsoever for arrays with zero delays and only a minor effect for guns with delays increasing as the delay is increased.
-
2011-Jul-15
- The calibration of G and 1900LLX guns was revisited and several datasets combined. Agreement between the datasets is good as can be seen by the updated calibration data below.
- In addition the discretisation accuracy of the model was improved which will give some slight differences across all signatures but as can be seen from the graphs which follow, they are indeed slight.
-
2011-Feb-05
- The calibration of Bolt 1500LL and 8500APG guns was revisited rationalising across several datasets including both near-field and far-field signatures. Agreement between the datasets is good as can be seen by the updated calibration data below.
- In addition the discretisation accuracy of the model was improved which will give some slight differences across all signatures but as can be seen from the graphs which follow, they are indeed slight.
-
2010-Jan-07
- Bolt 1900LLXT guns were added using data kindly supplied by Western Geco and Bolt. Agreement with modelled signatures is excellent with peak to peak within 2% across the range of gun volumes at 5m. Periods are accurate to around 1% and Primary to Bubble to about 10%. No other gun types are affected.
-
2009-Aug-22
- G Gun type II were modelled for the first time using data kindly supplied by Sercel. Agreement with the modelled signatures is excellent with peak to peak within 5% across all gun volumes and supplied depths. Periods are accurate to 1% and Primary to Bubble to about 15%. No other gun types are affected.
-
2009-Mar-31
- Sleeve Gun type II B/C were calibrated for the first time from an IO brochure dated 2004. Existing Sleeve Gun type I B/C calibrations are unaffected. Agreement with the parameters is excellent.
-
2009-Jan-07
- GI guns were re-calibrated against signature data given in Sercel's 2007 Marine Sources brochure. Agreement with the parameters is excellent although bubble periods are not given so this only applies to peak to peak and primary to bubble measurements.
-
2008-Apr-12
- From late October 2007, a new research project started to model guns with even greater accuracy for those guns with a good supply of data. This includes non-linear port modelling and a number of smaller physical phenomena such as modelling vertical bubble acceleration leading to variable periods at late signature times.
- The following gun types had sufficient consistent data from independent sources
to allow this to be done:-
- Bolt 1900LLX
- Sercel G 150 guns
- In particular, this included careful calibration against deep data allowing an unprecedented level of model accuracy for very deep guns.
-
2007-Apr-29
- This was not a calibration change strictly speaking but the calculated signatures will have changed very slightly as the algorithm was modified to improve its performance. The changes are negligible.
-
2006-Dec-12
- The cluster damping constant was adjusted slightly to fit across all datasets for all depths. This corrects a small residual tendency to over-predict the peak to peak for clusters. The difference is less than 5% for most arrays and single guns are unaffected.
-
2006-Aug-31
- Bolt 1500LL and 1900LLX guns were recalibrated against recent WesternGeco data after reconciling previous datasets by extracting the depths from the amplitude spectra rather than the field logs which were inaccurate on some datasets by up to 0.6m. This improves the fit across all calibration datasets significantly. Cluster damping was also adjusted based on detailed cluster data supplied by WesternGeco. This increases the damping to fit calibration primary to bubble data better. Small adjustments were also made to Bolt 8500APG calibration as part of the cluster re-calibration.
-
2006-Jun-02
- The model was adjusted to handle throttling inhibition more accurately using Bolt array data, the original Horizon clustered gun data and recent WesternGeco array data. This has a negligible effect on single guns but corrects the tendency of Gundalf to over-predict highly interacting arrays by about 10%.
-
2006-Mar-08
- Re-calibration and reconciliation of Bolt 1500LL, 1900LLX and 2800LLX from extensive single and clustered gun data kindly provided by WesternGeco with extensions to deep and shallow deployment. Some small adjustments also made to interaction which handled damping after the second bubble period rather better.
-
2004-Jan-06
- Re-calibration of Bolt 1500LL, 1900LLX and 8500APG from data kindly provided by Bolt Technology. Jet interaction slightly adjusted to predict bubble damping better.
-
2003-Feb-19
- Re-calibration of 1500C, G and GI guns from data kindly provided by CGG and also by Grant Geophysical.
-
2002-Nov-30
- Re-calibration of GI guns from data kindly provided by Grant Geophysical.
The effects of filtering
Signatures with and without filtering
Even when airgun signatures are measured in a calibrated facility, filtering differences can have a significant effect on the extracted statistics. The following table shows signature parameters extracted from a Bolt-supplied measurement facility far-field signature of a 200 cu.in. version of the popular 1500LL airgun with and without filtering.
Signature parameters and the effects of filtering
| Filter type | peak - peak (bar) | Primary to bubble | Bubble period (s) |
|---|---|---|---|
| Out | 0.111 | 3.509 | 0.099 |
| DFSV 5/0-512/72 | 0.112 | 3.741 | 0.096 |
Signatures filtered with two different filters with the same parameters
Signature parameters are not even unique when the same filtering parameters are used because digital filters might be constructed in slightly different ways. The following table shows the effects of this on the same signature as used above.
Signature parameters and the effects of two different filters with the same parameters
| Filter type | peak - peak (bar) | Primary to bubble | Bubble period (s) |
|---|---|---|---|
| Frequency domain constructed 5/0-512-72 | 0.118 | 3.509 | 0.099 |
| DFSV 5/0-512/72 | 0.112 | 3.703 | 0.097 |
Differently recorded signatures of the same gun
Several different sources were used for the calibration data presented here. Although each is high-quality and measured in an appropriate facility, on occasions they may only agree to within around 10%. Airguns themselves are generally highly consistent if performing normally, so such differences are almost certainly due to differences in hydrophone calibration, slight depth errors in hydrophone or gun placing, small variations in pressure or possibly filtering parameters which have not been documented properly. As an example, measurements of the same gun type and volume at two different facilities are shown below. The filtering was described as identical, although a mistake has obviously crept in somewhere. If such conflicts arise in Gundalf calibration, they are always resolved before calibration changes are applied. Gundalf is calibrated to best fit different sources of high-quality data for the same gun types.
Signatures for the same gun from different facilities presented as identically filtered
| Source | peak - peak (bar m.) | Primary to bubble | Bubble period (s) |
|---|---|---|---|
| Facility 1 | 5.308 | 3.870 | 0.082 |
| Facility 2 | 5.985 | 4.388 | 0.080 |
Effects on different signature parameters
The normal parameters used to characterise an airgun signature are either:-
- Zero to peak in bar-m.
- Primary to bubble zero to peak ratio
- Bubble period in seconds.
or
- Peak to peak in bar-m.
- Primary to bubble peak to peak ratio
- Bubble period in seconds.
Each has advantages and disadvantages. The former uses only the direct arrival and is therefore independent of any anelastic behaviour of the surface and its effects on the ghost. Unfortunately, certain kinds of filter, (DFS filters are notorious for this), will suppress the bubble peak differentially with respect to the bubble trough. If zero to peak measurement is used, a highly optimistic primary to bubble ratio may result and in such cases the latter parameters are more suitable because they are more robust to filter differences on positive and negative peaks. Note that in both cases, the signature has been corrected back to 1m. here. Measured far-field signatures are not normally thus corrected and will be given in bars.
In the data below, if peak to peak measurements are used, then the primary to bubble ratio is also calculated peak to peak. If zero to peak is used, the primary to bubble ratio is calculated using the zero to peak values.
Other modelling details
Note that all data were modelled with a sample interval of 0.5 msec and a flat sea surface was assumed with a reflection coefficient of -1.0.
Bolt 1500LL
Source of data
These signatures were supplied by Mike Saunders of Bolt in December 2003. They are high-quality data recorded at a specialist facility. The Gundalf model is displayed concurrently with the recorded data. The depth has been extracted directly from the first ghost notch on the amplitude spectra.
Note that the small ripples at multiples of approximately 200 msec in the measured data are due to side and bottom reflections at the measurement facility itself and do not appear in the modelled data which assumes an infinite medium.
Data parameters
- Water temperature 5 deg C.
- Filtering - out
- Hydrophone position (0.0, 0.0, 71.2)
- Gun position (0.0, 0.0, 5.62)
- Gun pressure 2000 psi.
Signatures
| Gun type | Modelled and recorded signatures |
|---|---|
| 1500 LL, 200 cu.in. | 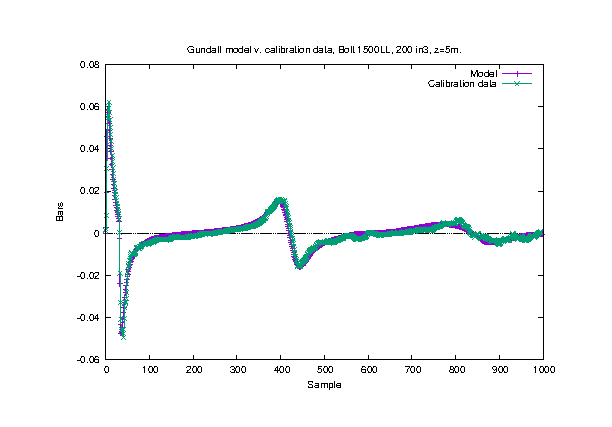 |
| 1500 LL, 300 cu.in. | 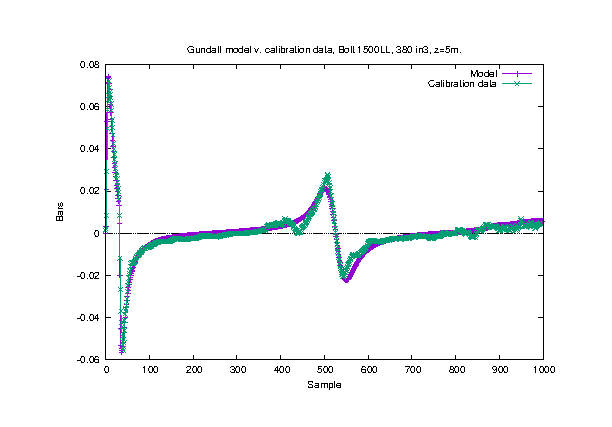 |
Source of data
These data show signature statistics of 1500LL volumes from 30-290 cuin. calibrated against high-quality near-field measurements with depth control corrected from far-field measurements of the same gun. The data were kindly supplied by WesternGeco.
Data parameters
- Water temperature 5 deg C.
- Filtering - dfsV 0-512Hz
- Hydrophone position (0.0, 0.0, 4.0)
- Gun position (0.0, 0.0, 5.00)
- Gun pressure 2000 psi.
Signature statistics
| Gun and data type | Modelled and recorded signature parameters |
|---|---|
| Bolt 1500LL bubble periods | 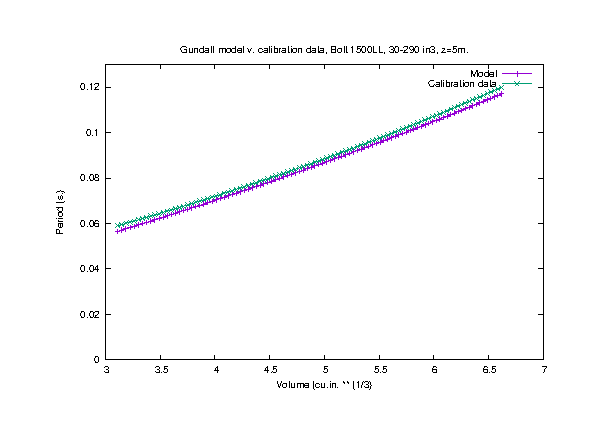 |
| Bolt 1500LL peak -> peak amplitude (bar-m.) | 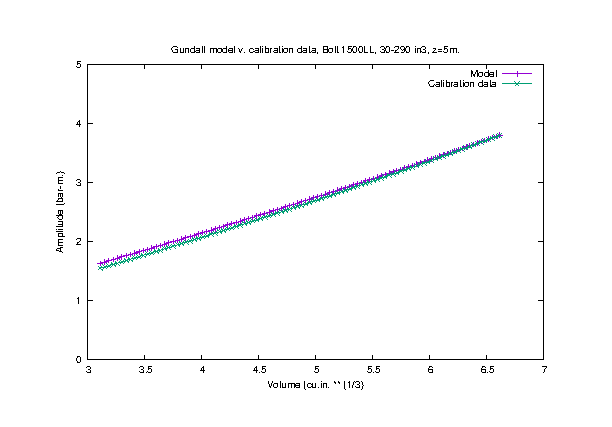 |
| Bolt 1500LL zero -> peak primary to bubble ratio | 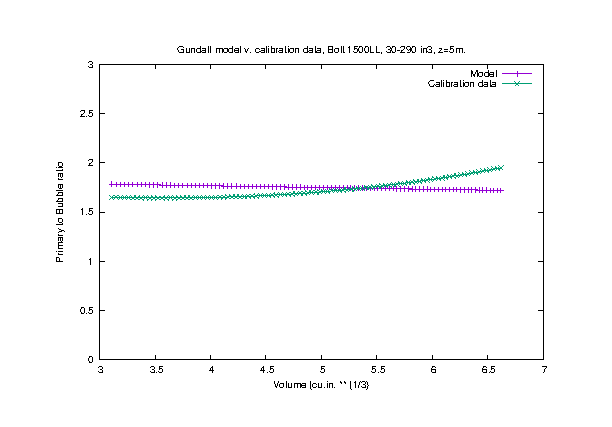 |
Bolt 1900LLX
Source of data
These data were supplied by Mike Saunders of Bolt in December 2003. They are high-quality data recorded at a specialist facility. The Gundalf model is displayed concurrently with the recorded data. The depth has been extracted directly from the first ghost notch on the amplitude spectra.
Note that the small ripples at multiples of approximately 200 msec in the measured data are due to side and bottom reflections at the measurement facility itself and do not appear in the modelled data which assumes an infinite medium.
Data parameters
- Water temperature 5 deg C.
- Filtering - out
- Hydrophone position (0.0, 0.0, 71.2)
- Gun position (0.0, 0.0, 5.28)
- Gun pressure 2000 psi.
Signatures
| Gun type | Modelled and recorded signatures |
|---|---|
| 1900LLX, 80 cu.in | 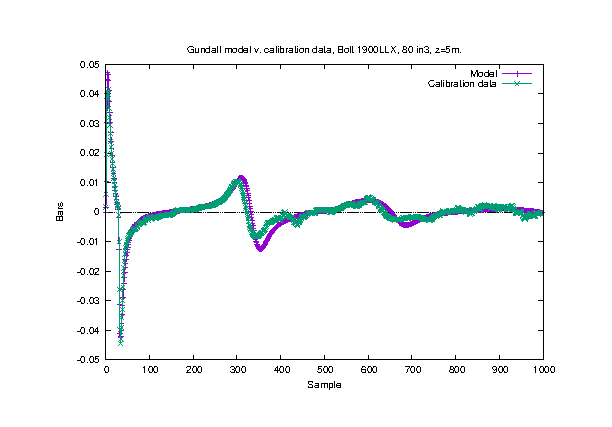 |
| 1900 LLX, 200 cu.in | 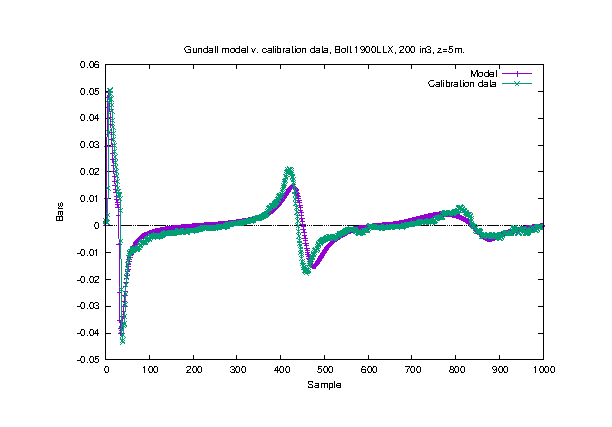 |
Bolt 1900LLXT
Source of data
These data were compiled from two sources. The Bolt brochure which gives a range of gun volumes 54-235 cuin at a depth of 5m and also signatures acquired at 10m by WesternGeco at a specialist deep-water facility under carefully controlled conditions for the same range of volumes. The two datasets match very well.
Data parameters
- Water temperature unknown (5m) and 5 deg C. (10m)
- Filtering - DFSV 0-128 (5m) and 6.0/18.0 - 500.0/48.0 (10m)
- Hydrophone position unknown (5m) and (0.0, 0.0, 9.0) (10m)
- Gun position unknown (5m) and (0.0, 0.0, 10.0) (10m)
- Gun pressure 2000 psi.
Signature parameters
| Gun and data type | Modelled and recorded signature parameters |
|---|---|
| Bolt 1900LLXT Gun bubble periods | 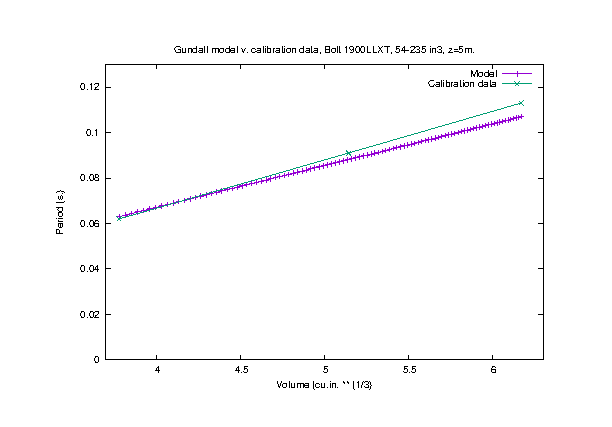 |
| Bolt 1900LLXT Gun Zero -> peak amplitude (bar-m.) | 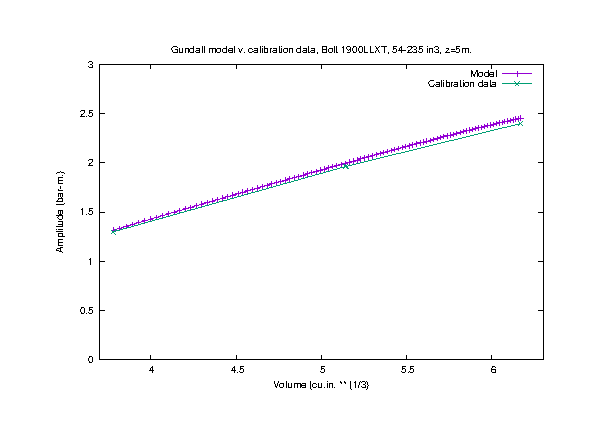 |
| Bolt 1900LLXT Gun zero -> peak primary to bubble ratio | 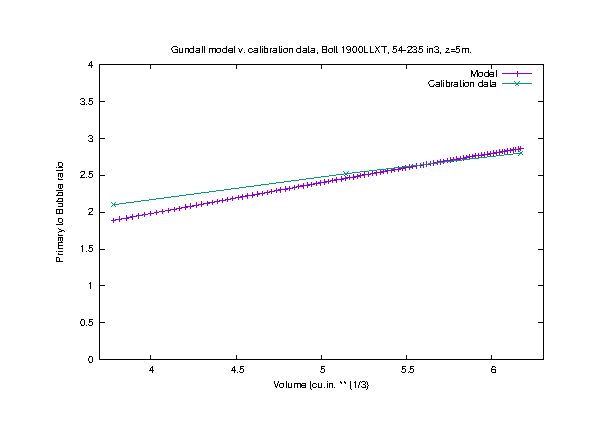 |
Bolt 8500 APG
Source of data
These data were supplied by Mike Saunders of Bolt in December 2003. They are high-quality data recorded at a specialist facility. The depth has been extracted directly from the first ghost notch on the amplitude spectra. The Gundalf model and recorded signatures are shown accompanied by graphs of signature parameters over the full range of volumes.
Note that the small ripples at multiples of approximately 200 msec in the measured data are due to side and bottom reflections at the measurement facility itself and do not appear in the modelled data which assumes an infinite medium.
Data parameters
- Water temperature 5 deg C.
- Filtering - out
- Hydrophone position (0.0, 0.0, 71.2)
- Gun position (0.0, 0.0, 5.62)
- Gun pressure 2000 psi.
Signatures
| Gun type | Modelled and recorded signatures |
|---|---|
| 8500 LL (APG), 80 cu.in. | 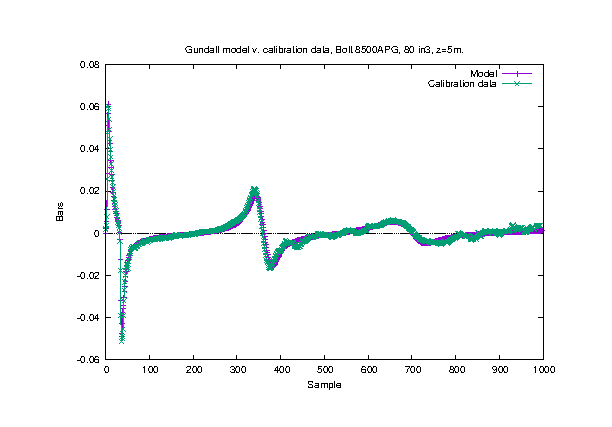 |
| 8500 LL (APG), 200 cu.in. | 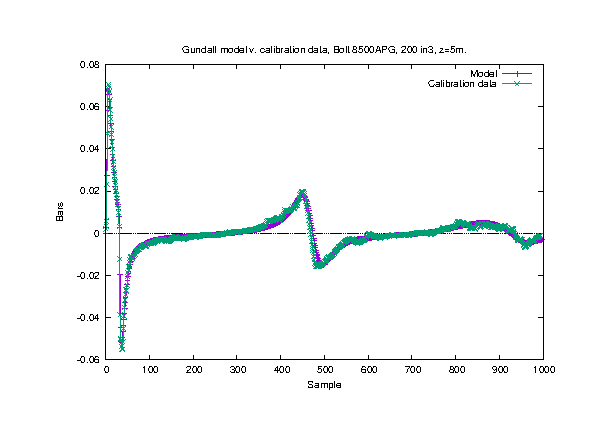 |
| 8500 LL (APG), 380 cu.in. | 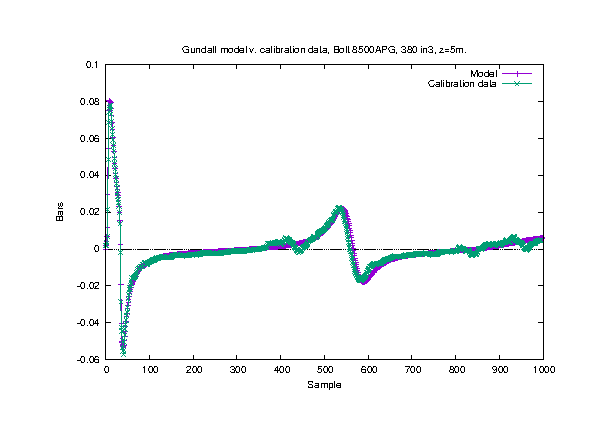 |
| Gun type | Modelled and recorded signature parameters |
|---|---|
| APG Gun bubble periods | 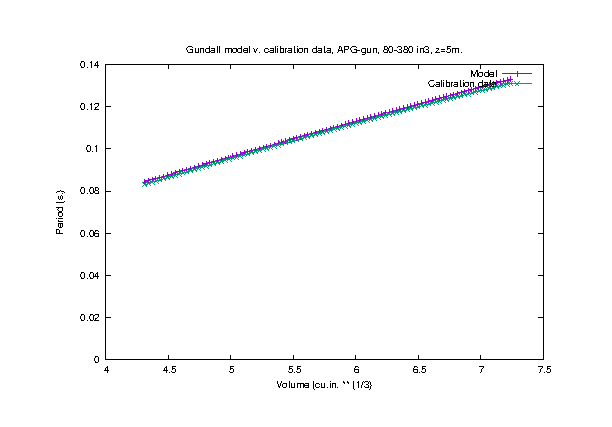 |
| APG Gun peak -> peak amplitude (bar-m.) | 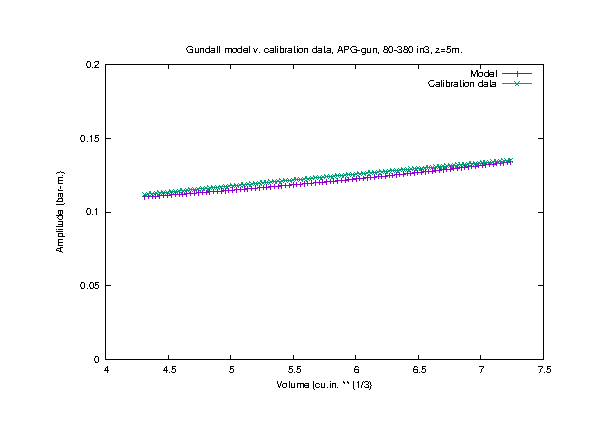 |
| APG Gun zero -> peark primary to bubble ratio | 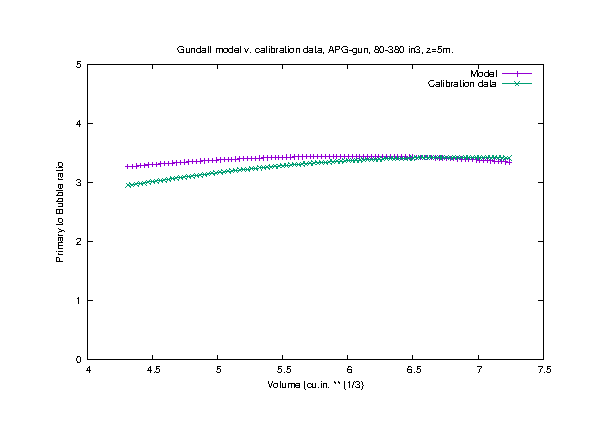 |
Bolt 2800LLX
Source of data
These high-quality data were supplied by WesternGeco in October 2005. They were recorded at a specialist deep-water facility under carefully controlled conditions. The Gundalf modelled parameters and recorded parameters are shown over the full range of volumes at a conventional towing depth of 6m.
Data parameters
- Water temperature 5 deg C.
- Filtering - 5/18-512.72
- Hydrophone position (0.0, 0.0, 140.0)
- Gun position (0.0, 0.0., 6.0)
- Gun pressure 2000psi.
Signature parameters
| Gun and data types | Modelled and recorded signature parameters |
|---|---|
| Bolt 2800LLX Gun bubble periods | 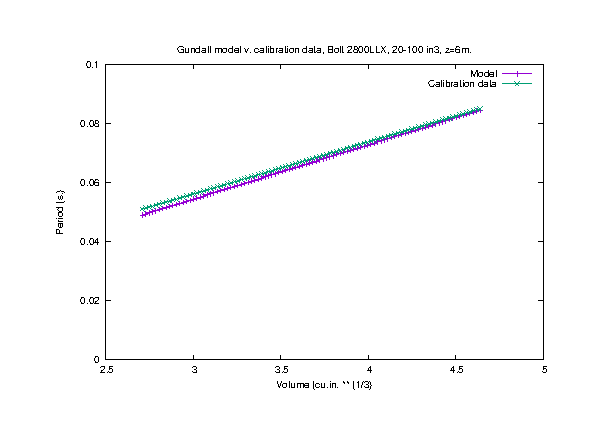 |
| Bolt 2800LLX Gun Zero -> peak amplitude (bar-m.) | 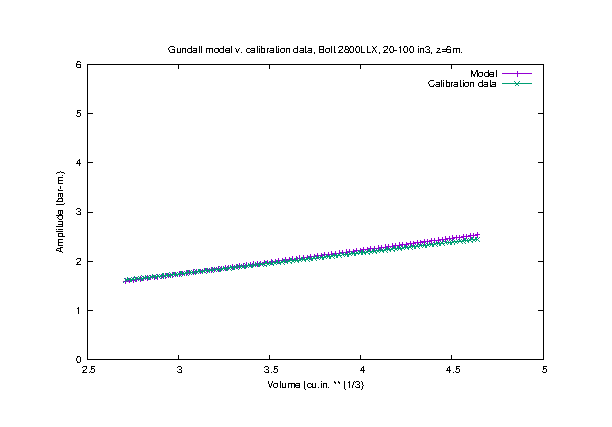 |
| Bolt 2800LLX Gun Zero -> peak primary to bubble ratio | 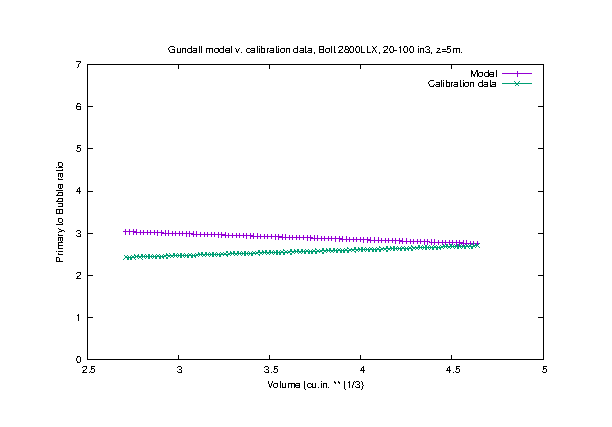 |
Bolt e500, types A, B and C
Source of data
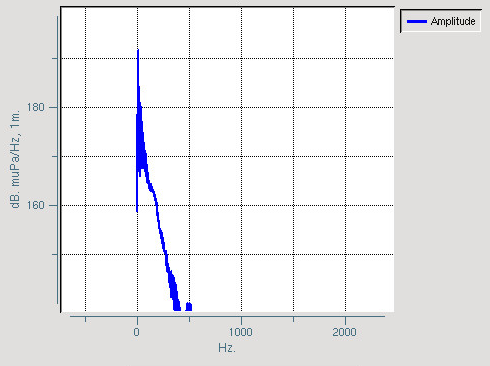
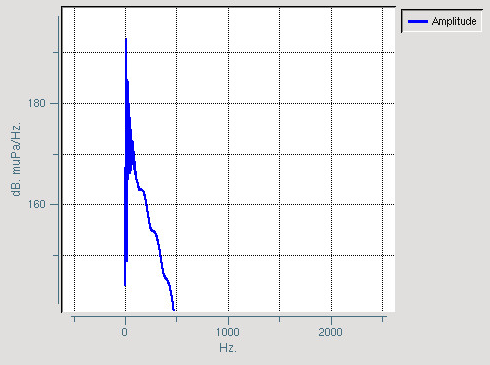
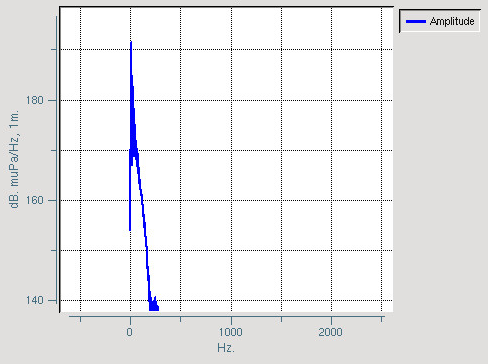
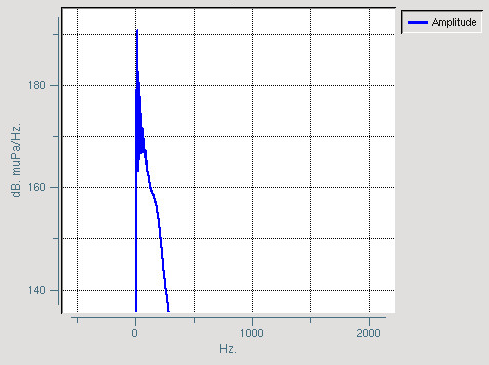
These very high-quality broadband data were jointly supplied by Bolt and Schlumberger-WesternGeco in the period June-December 2014. They were recorded at a specialist deep-water facility under carefully controlled conditions with multiple transducers in the near and far-field and extensive data-logging including noise traces indicating the useable dynamic range to be in the range 40-50dB. The Gundalf modelled parameters and recorded parameters are shown over the full range of volumes at a conventional towing depth of 6m based on near-field hydrophones. Each signature was measured independently a number of times giving excellent redundancy and allowing error bounds to be placed on the measurements, making this one of the best curated datasets we have been able to use.
The dynamic range and the signatures themselves confirms that the anisotropy of the oscillating bubble is fundamentally turbulent allowing only approximate estimates to be made at kHz. frequencies, although these values are very low for this gun type as can be seen by the amplitude spectral comparisons below.
Data parameters
- Water temperature - various but logged.
- Filtering - out
- Hydrophone position - multiple NF and FF.
- Gun position (0.0, 0.0, 6.0)
- Gun pressure nominal 2000 psi. but logged.
- Sample interval 0.00002 s giving a 0-25kHz bandwidth.
Signature parameters
| Gun and data type | Modelled and recorded signature parameters |
|---|---|
| Bolt e500A Gun bubble periods | 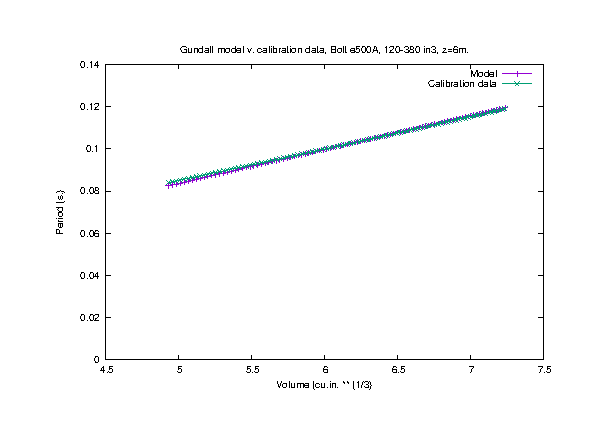 |
| Bolt e500A Gun zero -> peak amplitude (bar-m.) | 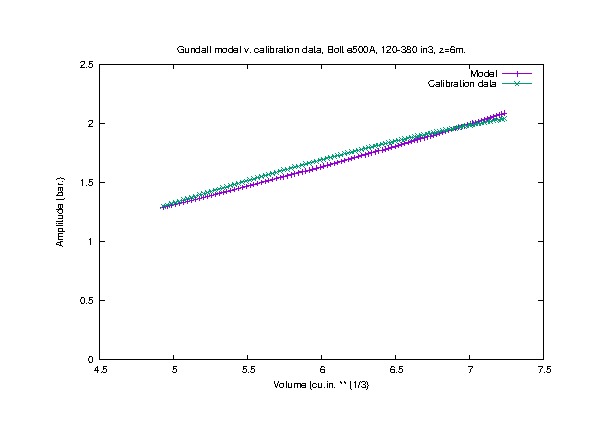 |
| Bolt e500A Gun zero -> peak primary to bubble ratio | 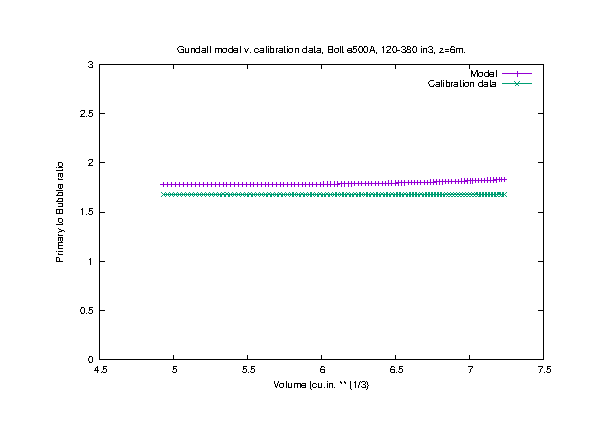 |
| Gun and data type | Modelled and recorded signature parameters |
|---|---|
| Bolt e500B Gun bubble periods | 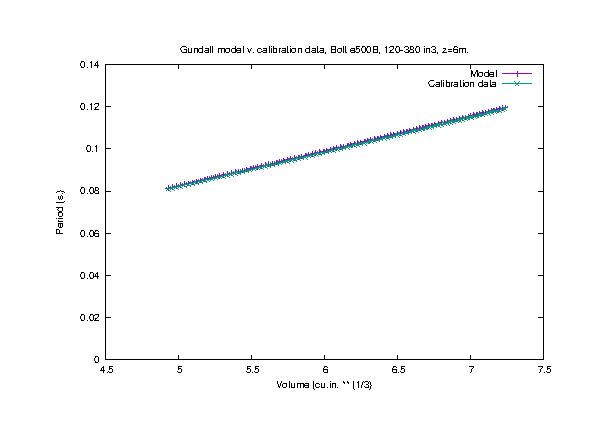 |
| Bolt e500B Gun zero -> peak amplitude (bar-m.) | 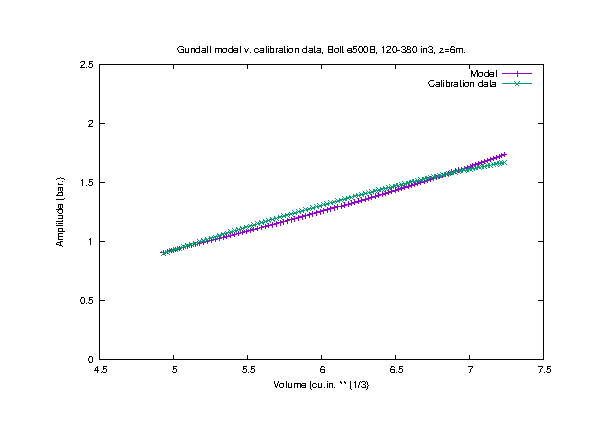 |
| Bolt e500B Gun zero -> peak primary to bubble ratio | 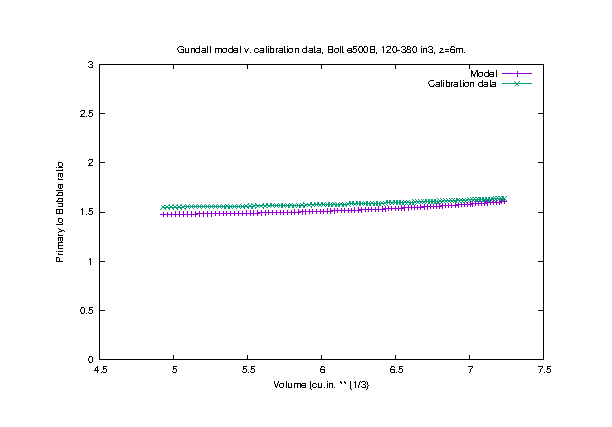 |
e500 type C guns have proven to be a little more difficult to calibrate and are currently registered in Gundalf as type 1 or code yellow calibration quality in comparison with types A and B which are both code green, the highest calibration quality.
| Gun and data type | Modelled and recorded signature parameters |
|---|---|
| Bolt e500C Gun bubble periods | 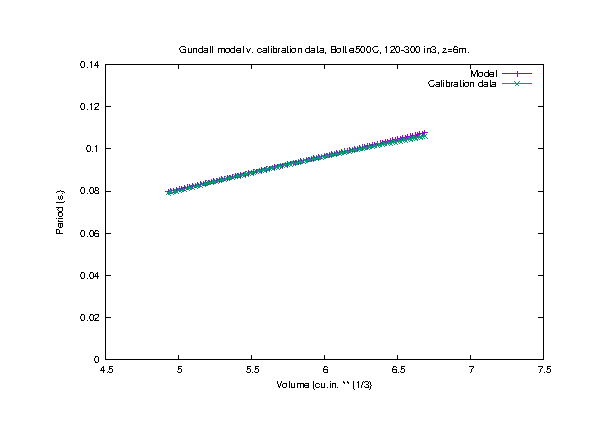 |
| Bolt e500C Gun zero -> peak amplitude (bar-m.) | 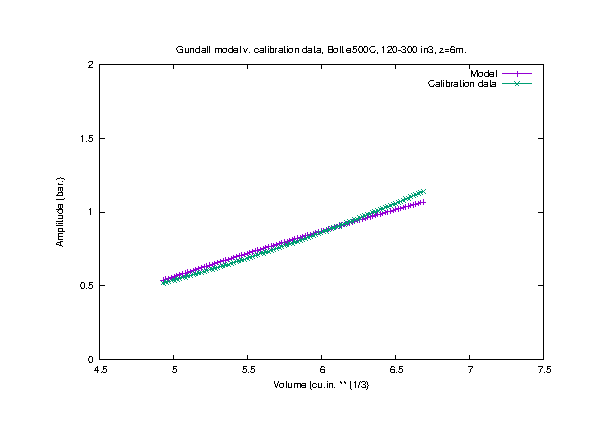 |
| Bolt e500C Gun zero -> peak primary to bubble ratio | 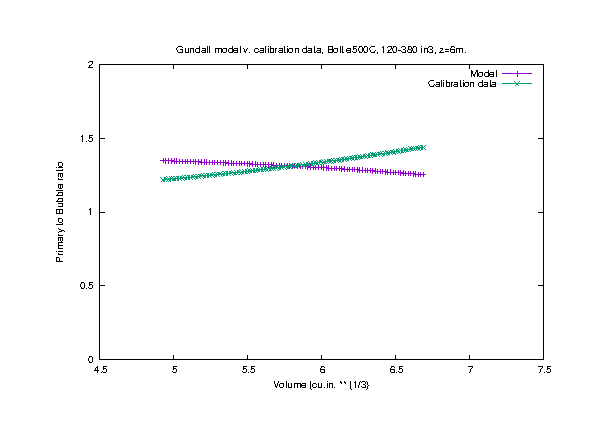 |
The noise traces in this experiment suggest a useable dynamic range of 40-50dB whilst the data signatures indicate the random nature of the frequencies outside this range. The following spectral plots therefore indicate in broad terms the rapid decline in high frequencies for this gun type within the dynamic range indicated in the noise traces and its prediction within Gundalf. For all three types of e500, Gundalf accurately predicts the overall spectral shape within the region of good signal to noise.
Amplitude spectral characteristics
| e500A measured spectrum | Gundalf modelled e500A spectrum |
|---|---|
 |
 |
| e500B measured spectrum | Gundalf modelled e500B spectrum |
|---|---|
 |
 |
| e500C measured spectrum | Gundalf modelled e500C spectrum |
|---|---|
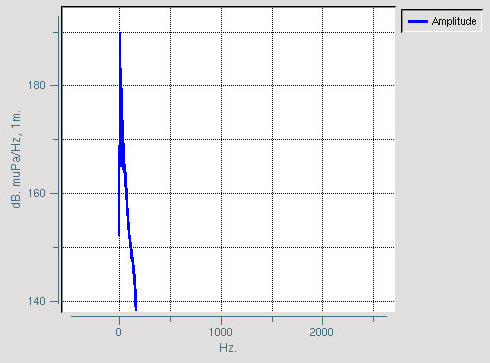 |
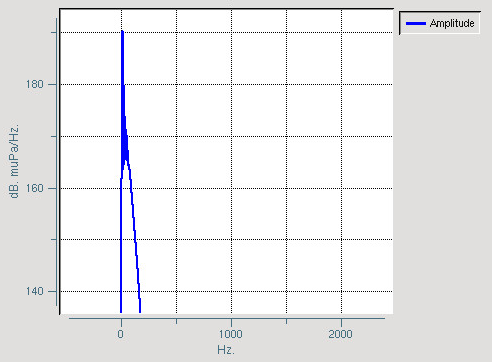 |
Bolt e300, types A, B and C
Source of data
These very high-quality broadband data were jointly supplied by Bolt and Schlumberger-WesternGeco in the period December 2015 - January 2016. They were recorded at a specialist deep-water facility under carefully controlled conditions with multiple transducers in the near and far-field and extensive data-logging including noise traces indicating the useable dynamic range to be in the range 40-50dB. The Gundalf modelled parameters and recorded parameters are shown over the full range of volumes at a conventional towing depth of 6m based on near-field hydrophones. Each signature was measured independently a number of times giving excellent redundancy and allowing error bounds to be placed on the measurements, making this one of the best curated datasets we have been able to use.
The dynamic range and the signatures themselves confirms that the anisotropy of the oscillating bubble is fundamentally turbulent allowing only approximate estimates to be made at kHz. frequencies, although these values are very low for this gun type as can be seen by the amplitude spectral comparisons below.
Data parameters
- Water temperature - various but logged.
- Filtering - out
- Hydrophone position - multiple NF and FF.
- Gun position (0.0, 0.0, 6.0)
- Gun pressure nominal 2000 psi. but logged.
- Sample interval 0.00002 s giving a 0-25kHz bandwidth.
Signature parameters
| Gun and data types | Modelled and recorded signature parameters |
|---|---|
| Bolt e300A Gun bubble periods | 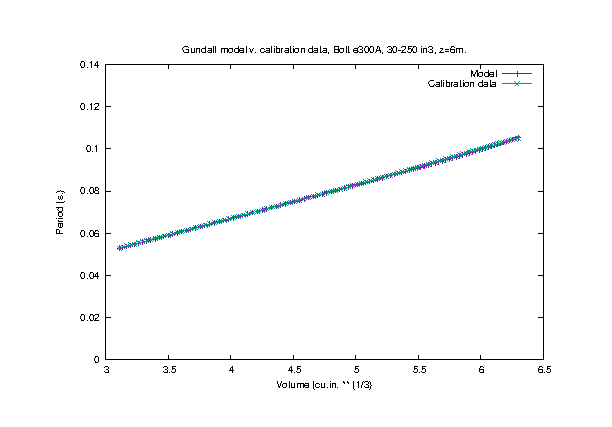 |
| Bolt e300A Gun zero -> peak amplitude (bar-m.) | 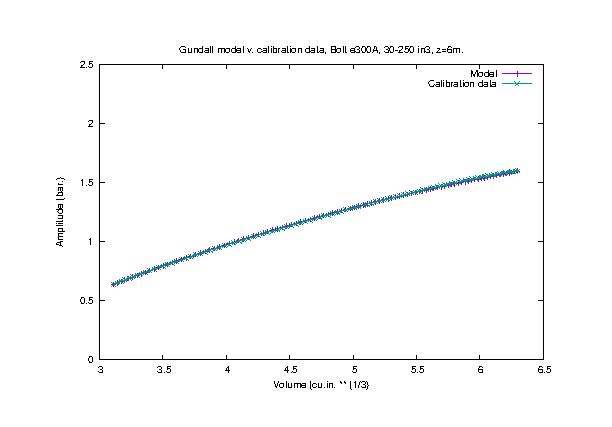 |
| Bolt e300A Gun zero -> peak primary to bubble ratio | 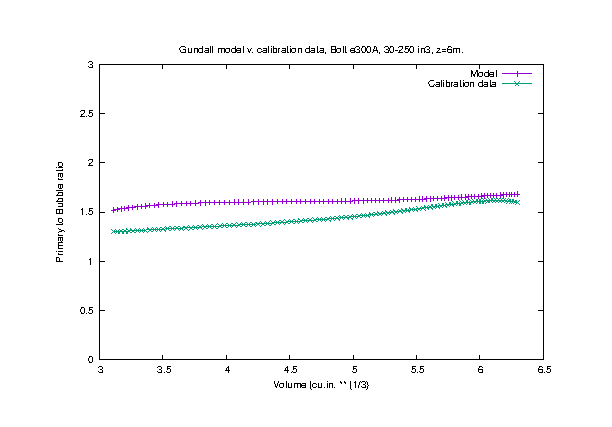 |
| Gun and data types | Modelled and recorded signature paramters |
|---|---|
| Bolt e300B Gun bubble periods | 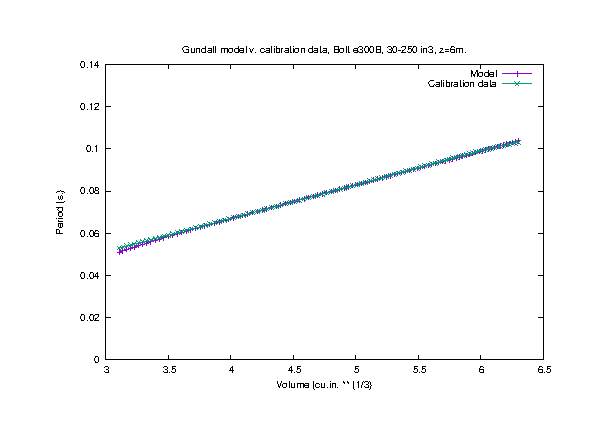 |
| Bolt e300B Gun zero -> peak amplitude (bar-m.) | 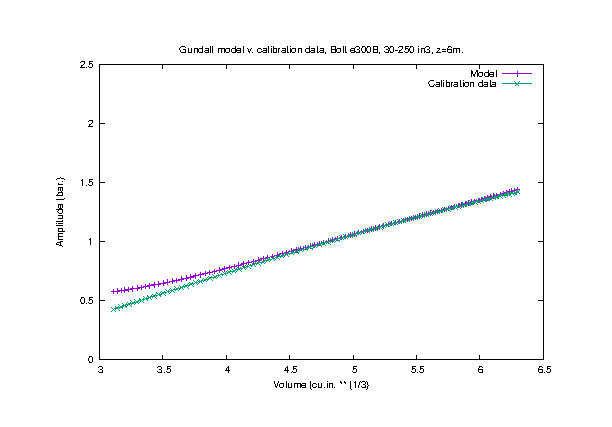 |
| Bolt e300B Gun zero -> peak primary to bubble ratio | 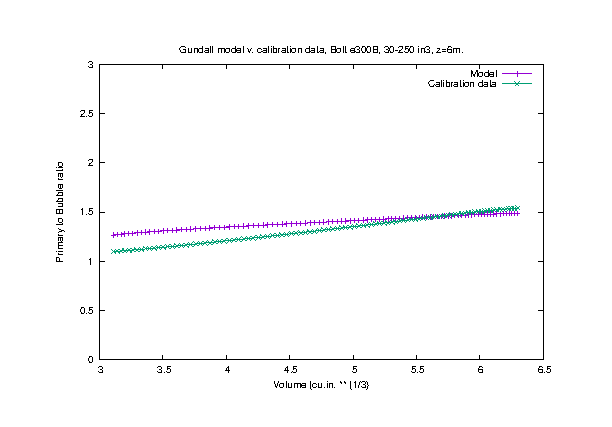 |
e300 type C guns have proven to be a little more difficult to calibrate and are currently registered in Gundalf as type 1 or code yellow calibration quality in comparison with types A and B which are both code green, the highest calibration quality.
| Gun and data types | Modelled and recorded signature parameters |
|---|---|
| Bolt e300C Gun bubble periods | 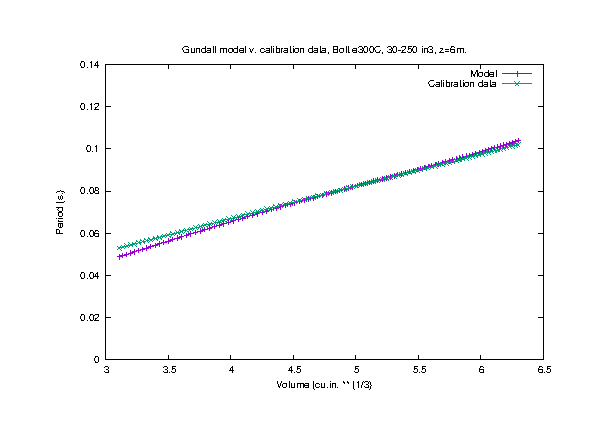 |
| Bolt e300C Gun zero -> peak amplitude (bar-m). | 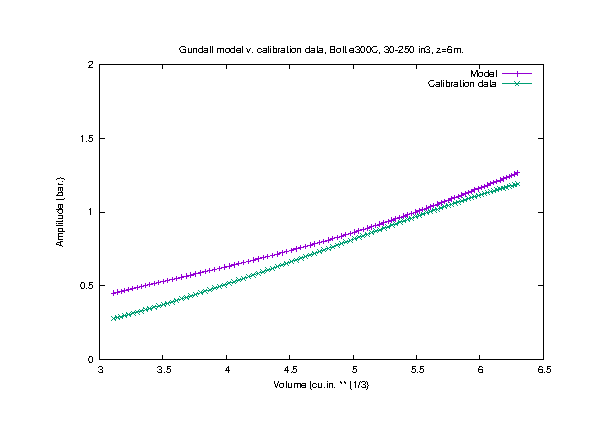 |
| Bolt e300C Gun zero -> peak primary to bubble ratio | 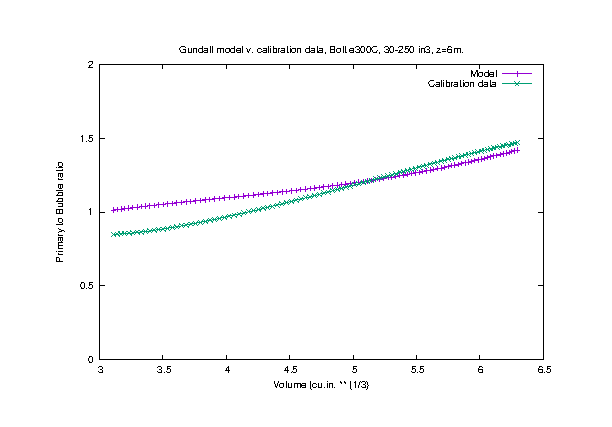 |
The noise traces in this experiment suggest a useable dynamic range of 40-50dB whilst the data signatures indicate the random nature of the frequencies outside this range. The following spectral plots therefore indicate in broad terms the rapid decline in high frequencies for this gun type within the dynamic range indicated in the noise traces and its prediction within Gundalf. For all three types of e300, Gundalf accurately predicts the overall spectral shape within the region of good signal to noise.
Amplitude spectral characteristics
| e300A measured spectrum | Gundalf modelled e300A spectrum |
|---|---|
 |
 |
| e300B measured spectrum | Gundalf modelled e300B spectrum |
|---|---|
 |
 |
| e300C measured spectrum | Gundalf modelled e300C spectrum |
|---|---|
 |
 |
Deep Bolt 1500LL
Source of data
These high-quality data were supplied by WesternGeco in October 2005. They were recorded at a specialist deep-water facility under carefully controlled conditions. The Gundalf modelled parameters and recorded parameters are shown over the full range of volumes at 30m. Depths have been corrected using far-field data.
Data parameters
- Water temperature 5 deg C.
- Filtering - 5/18-512/72
- Approximate hydrophone position (0.0, 0.0, 140.0)
- Gun position (0.0, 0.0, 30.0)
- Gun pressure 2000 psi.
Signature parameters
| Gun and data type | Modelled and recorded signature parameters |
|---|---|
| Bolt 1500LL Gun bubble periods at 30m. | 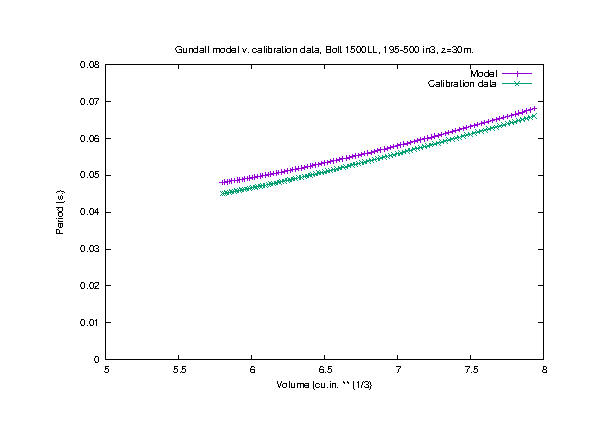 |
| Bolt 1500LL Gun zero -> peak amplitude (bar-m.) at 30m. | 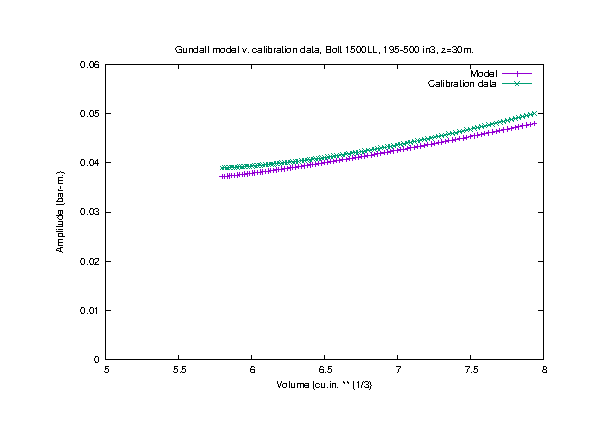 |
| Bolt 1500LL Gun zero -> peak primary to bubble ratio at 30m. | 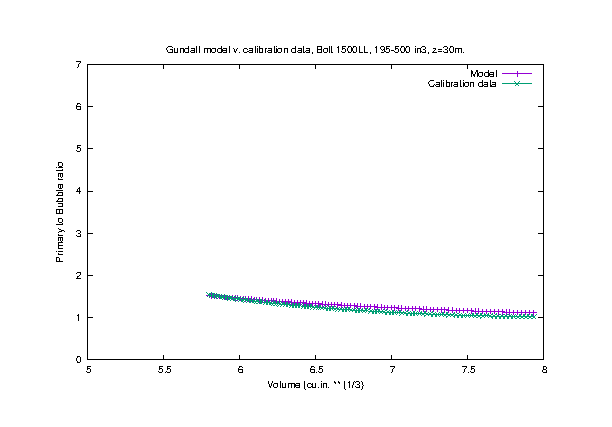 |
Shallow Bolt 1900LLX
Source of data
These high-quality data were supplied by WesternGeco in October 2005. They were recorded at a specialist deep-water facility under carefully controlled conditions. The Gundalf modelled parameters and recorded parameters are shown for a single 1900LLX gun for depths ranging from 3m to 10m.
Data parameters
- Water temperature 5 deg C.
- Filtering - 5/18-512/72
- Hydrophone position (0.0, 0.0, 140.0)
- Gun position (0.0, 0.0, 30.0)
- Gun pressure 2000 psi.
Signature parameters
| Gun and data type | Modelled and recorded signature paramters |
|---|---|
| Bolt 1900LLX Gun bubble periods v. depth | 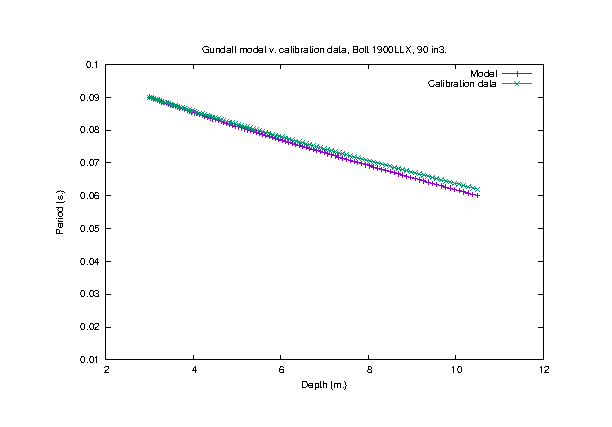 |
| Bolt 1900LLX Gun zero -> peak amplitude (bar-m.) v. depth | 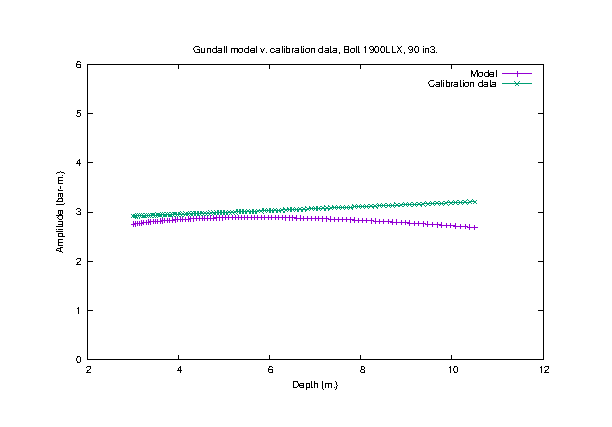 |
| Bolt 1900LLX Gun zero -> peak primary to bubble ratio v. depth | 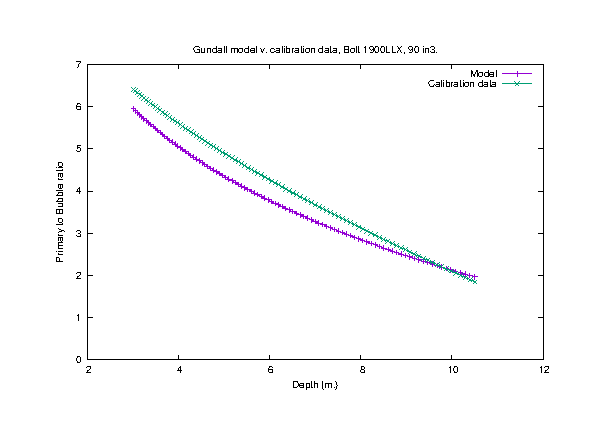 |
Deep Sodera G 150 gun
Source of data
These high-quality data were supplied by WesternGeco in March 2007. They were recorded at a specialist deep-water facility under carefully controlled conditions. The Gundalf modelled parameters and recorded parameters are shown for a single G 150 gun for depths ranging from 10m to 30m. Depths have been corrected using far-field data.
Data parameters
- Water temperature 5 deg C.
- Filtering - 5/18-512/72
- Approximate hydrophone position (0.0, 0.0, 160.0)
- Gun pressure 2000 psi.
Signature parameters
| Gun and data types | Modelled and recorded signature parameters |
|---|---|
| G 150 Gun bubble periods v. depth | 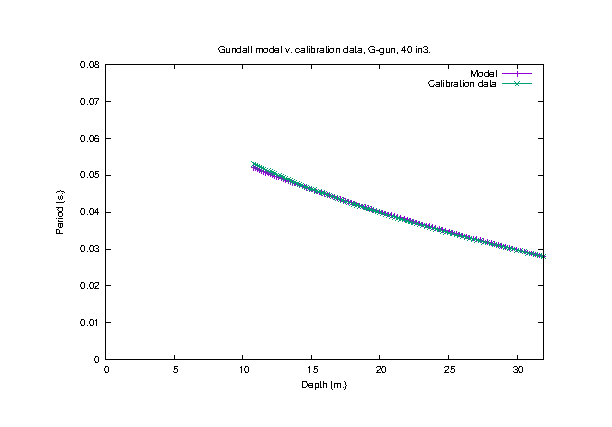 |
| G 150 Gun peak -> peak amplitude (bar.) v. depth | 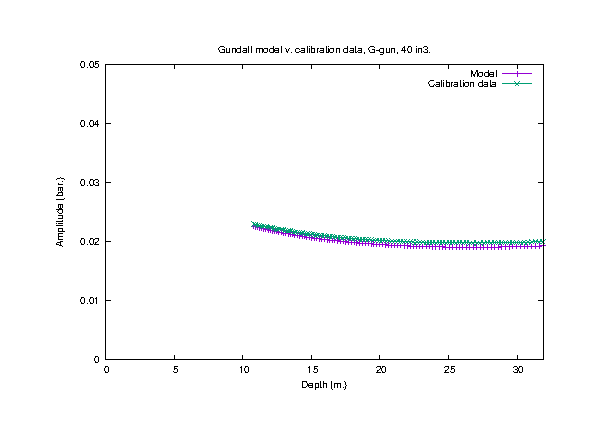 |
| G 150 Gun peak -> peak primary to bubble ratio v.depth | 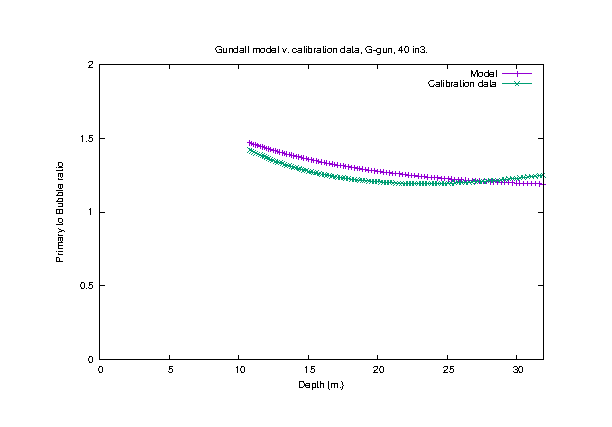 |
Clustered Bolt 1900LLX
Source of data
These high-quality data were supplied by WesternGeco in August 2005. They were recorded at a specialist deep-water facility under carefully controlled conditions. The Gundalf modelled parameters and recorded parameters are shown for a two-gun 1900LLX cluster for depths ranging from 3m to 10m.
Data parameters
- Water temperature 5 deg C.
- Filtering - 0/0-256/72
- Hydrophone position (0.0, 0.0, 140.0)
- Gun position (0.0, 0.0, 3.0-10.0)
- Gun pressure 2000 psi.
Signature parameters
| Gun and data types | Modelled and recorded signature parameters |
|---|---|
| Bolt 1900LLX 2-gun cluster bubble periods v. depth | 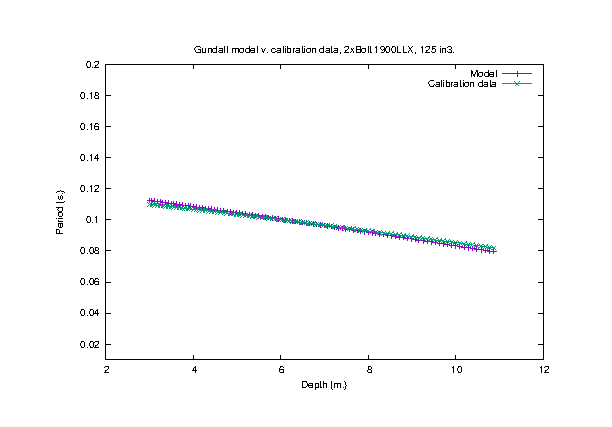 |
| Bolt 1900LLX 2-gun cluster zero -> peak amplitude (bar-m.) v.depth | 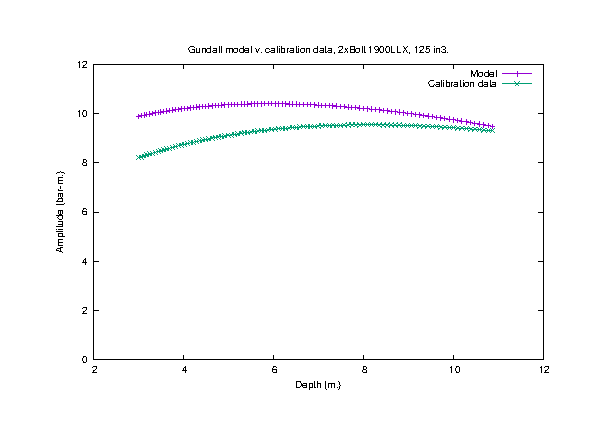 |
| Bolt 1900LLX 2-gun cluster zero -> peak primary to bubble ratio v. depth | 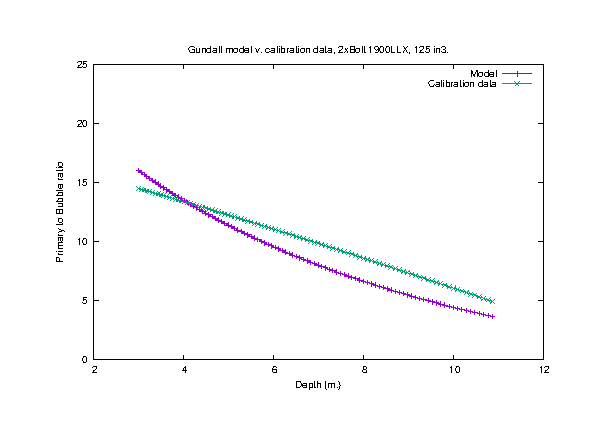 |
Sleeve type I
Source of data
These high-quality data were supplied by Alain Regnault of CGG in May 2003. A range of single guns were used and the data are showed as zero - Peak amplitude, zero - Peak primary to bubble and bubble period for a range of guns from 45-250 cu.in.
Data parameters
- Water temperature 25 deg C.
- Filtering - 0/0 - 350/23
- Hydrophone position (5.0, 5.0, 6.7)
- Gun position (5.0, 5.0, 7.5)
- Gun pressure 1885 psi.
Signatures
| Gun and data types | Modelled and recorded signature parameters |
|---|---|
| Sleeve Gun bubble periods | 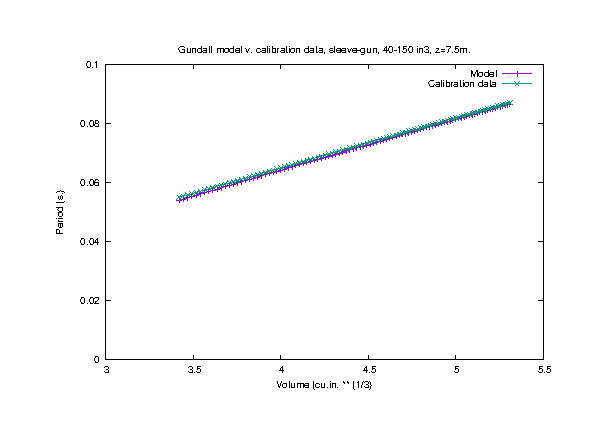 |
| Sleeve Gun zero -> peak amplitude (bar-m.) | 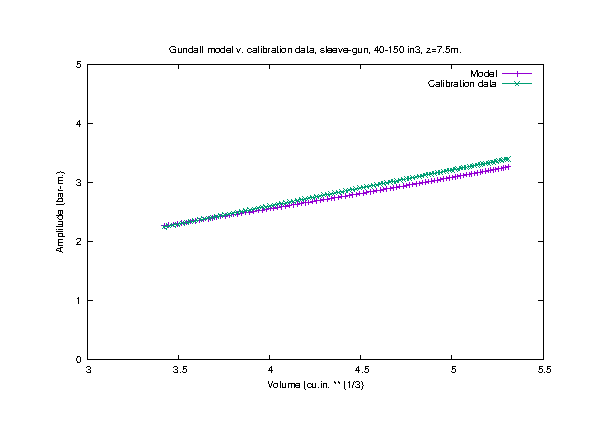 |
| Sleeve Gun zero -> peak primary to bubble ratio | 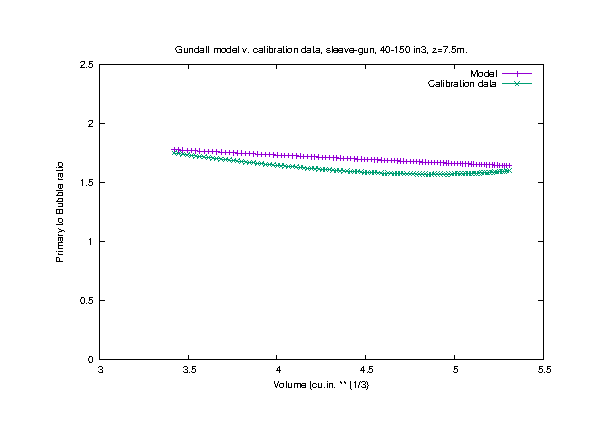 |
Sleeve type II guns
Source of data
These high-quality data were taken from the IO brochure dated 2004. A range of single guns were used and the data are showed as zero - Peak amplitude, zero - Peak primary to bubble and bubble period for a range of guns from 70-300 cu.in. Agreement is excellent across the full range of volumes.
Data parameters
- Water temperature - unknown
- Filtering - 0/0 - 1500/72
- Hydrophone position - unknown
- Gun position - unknown
- Gun pressure 2000 psi
| Gun and data types | Modelled and recorded signature parameters |
|---|---|
| Sleeve Gun II bubble periods | 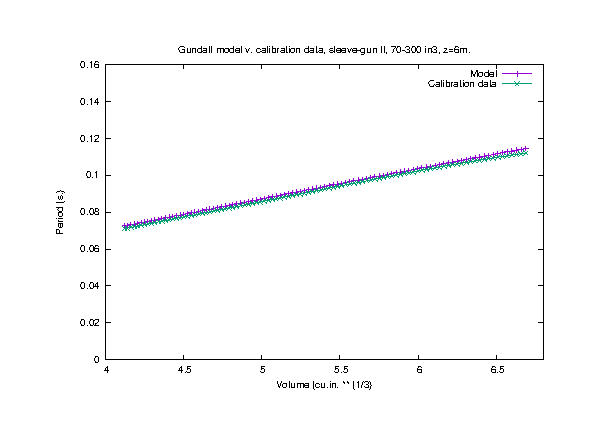 |
| Sleeve Gun II zero -> peak amplitude (bar-m.) | 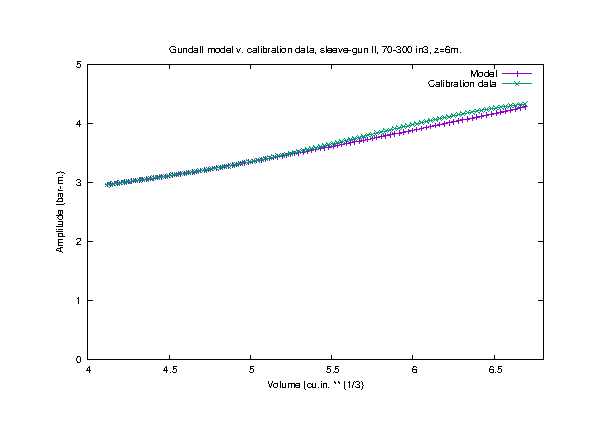 |
| Sleeve Gun II zero -> peak primary to bubble ratio | 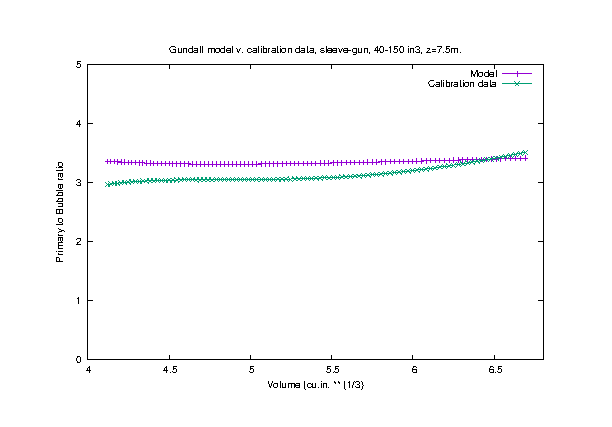 |
GI guns
Source of data
These data were extracted from the Sercel Marine Sources brochure from 2007. No signatures are available so the peak to peak and primary to bubble have been taken from the brochure for GI guns in normal airgun mode, harmonic mode and true GI mode for a 150 cu.in. gun and also in harmonic mode for 90, 150 and 210 cu.in. guns.
Data parameters
- Water temperature unknown
- Filtering - 0/0 - 256/72 DFSV
- Hydrophone position unknown, far-field assumed
- Gun position (0.0, 0.0, 6.0)
- Gun pressure 2000 psi.
In each case, the data is shown in black and the Gundalf modelled value is shown in red. Agreement with single gun values is excellent across each of the examples given in the brochure. Clustered examples in the brochure have not been modelled due to the lack of relevant information such as cluster separation. Periods are not shown as this information is also not provided.
Single 150 cu.in. GI gun in each mode
| Gun mode | peak - peak (bar-m) | Primary to bubble |
|---|---|---|
| Normal (airgun mode) | 4.9 (4.8) | 2.1 (2.4) |
| Harmonic (G:I - 50:50) | 3.7 (3.7) | 8.6 (10.0) |
| True GI (G:I - 30:70) | 2.9 (3.1) | 13.9 (14.2) |
GI Gun Harmonic mode, 3 basic volumes
| Volume (cu.in.) | peak - peak (bar-m) | Primary to bubble |
|---|---|---|
| 90 | 3.0 (3.1) | 7.3 (8.0) |
| 150 | 3.7 (3.7) | 8.6 (10.0) |
| 210 | 4.0 (4.2) | 9.8 (9.3) |
G type I guns
Source of data
These high-quality data were supplied by Alain Regnault of CGG in May 2003. A range of single guns were used and the data are showed as zero - Peak amplitude, zero - Peak primary to bubble and bubble period for a range of guns from 45-250 cu.in.
Data parameters
- Water temperature 25 deg C.
- Filtering - 0/0 - 350/23
- Hydrophone position (5.0, 5.0, 5.2)
- Gun position (5.0, 5.0, 6.0)
- Gun pressure 1900 psi
Signatures
| Gun and data types | Modelled and recorded signature parameters |
|---|---|
| G Gun bubble periods | 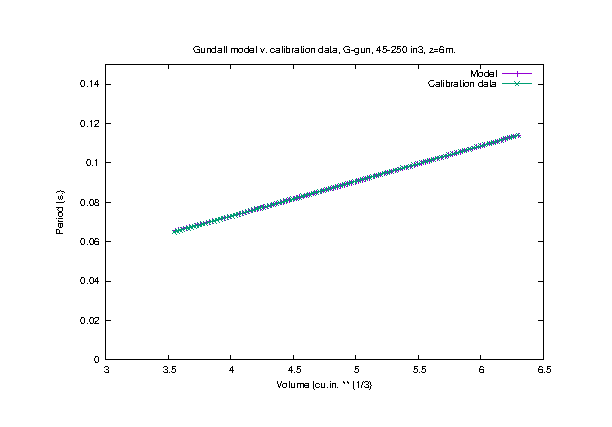 |
| G Gun zero -> peak amplitude (bar-m.) | 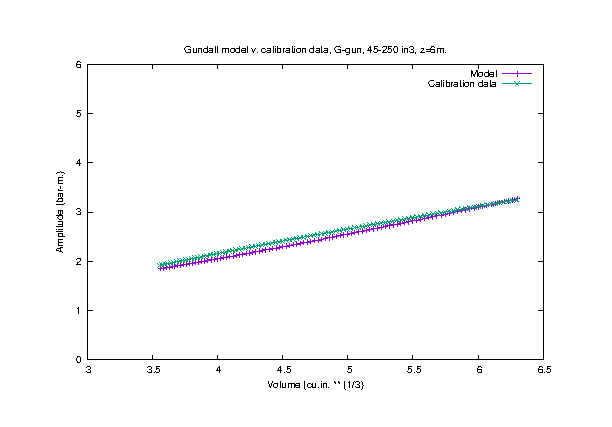 |
| G Gun zero -> peak primary to bubble ratio | 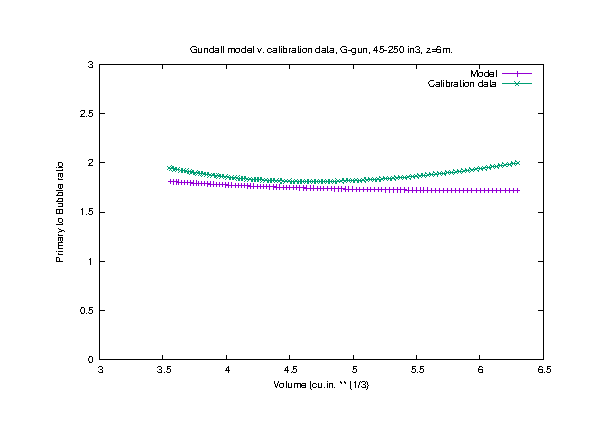 |
G type II guns
Source of data
These high-quality data were supplied by Sercel in 2015 and were acquired in 2013-14. A range of single guns were used and the data are showed as zero - Peak amplitude, zero - Peak primary to bubble and bubble period for a range of guns from 90-520 cu.in. Agreement is excellent across the full range of volumes. Calibration depths were in the range 3-15m for some gun types but only 6m data is shown. Calibration quality is similar across all calibration depths. The G-GunII is somewhat unusual in its significantly increased P2B for the larger volumes, so calibration errors were chosen to be centered in the middle of the range.
Data parameters
- Water temperature - unknown.
- Filtering - none, (sample interval of recordings = 0.05msec)
- Hydrophone position - 2 and 3m below gun, signatures normalised to bar-m
- Gun position - 6m.
- Gun pressure 2000 psi and monitored
Signature parameters
| Gun and data type | Modelled and recorded signature parameters |
|---|---|
| G Gun II bubble periods | 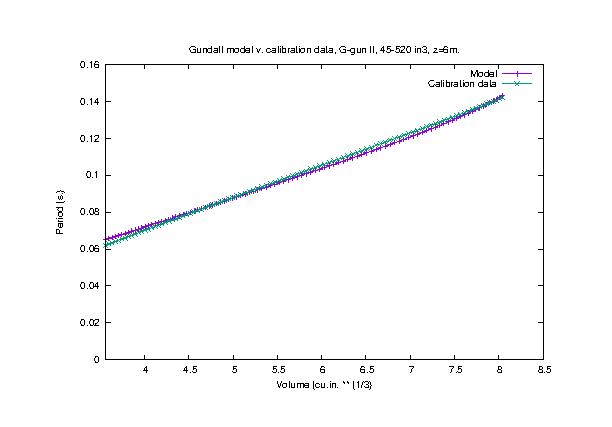 |
| G Gun II zero -> peak amplitude (bar-m.) | 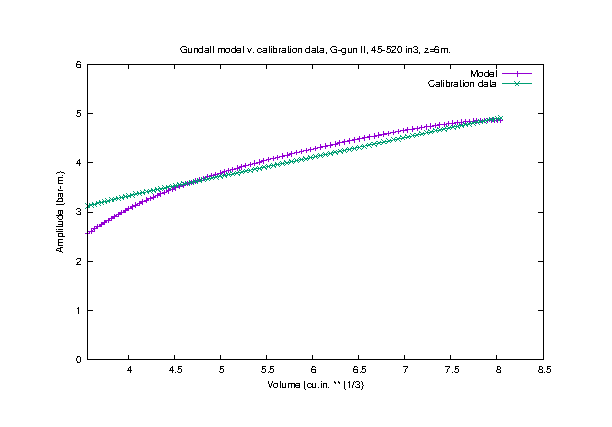 |
| G Gun II zero -> peak primary to bubble ratio | 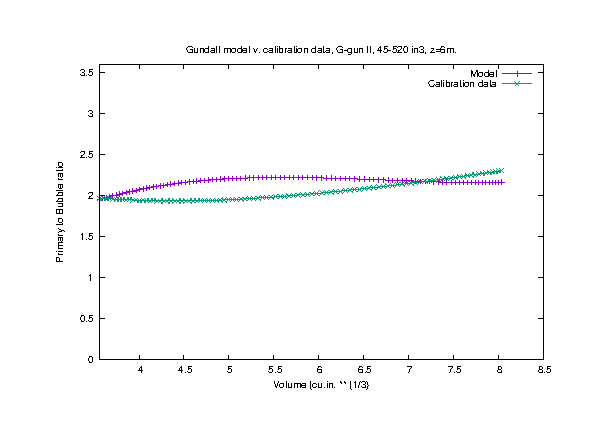 |
Independent field calibration data
McCauley et. al. (2017), (Nature Ecology and Evolution (1) 0195, p. 1-8 DOI 10.1038/s41559-017-0195), operate a single 150cuin. G-GunII deployed at 5.1m depth in a study of acoustic impact on zooplankton. They measure the output as 183dB SPL at a range of 509-658m and 178dB SPL at a range of 973-1,119m. These are identical to the figures produced by Gundalf.
Blue Pulse 100Hz and 200Hz
Introduction
An important new source aimed at minimising the impact on sea-life sensitive to the higher frequencies. Like the Teledyne Bolt eSource, the Sercel BluePulse guns are based on the reliable and well-known G-GunII design but with shuttle modification to slow the rise-time of the normal gun. The effect as with the eSource is to greatly attenuate frequencies much above their target frequencies of either 200Hz or 100Hz.
Source of data
These data originate from a datasheet by Sercel, and the following paper "A new wave in marine seismic source technology", Tellier N., Large J., Ronen S., Aznar J. (2021), DOI: 10.3997/1365-2397.fb2021088
Data parameters
- Water temperature Unknown
- Filtering - out
- Hydrophone position - Near-field so results quoted as relative. 8m depth assumed.
- Gun position (0.0, 0.0, 7.00) (Ghost indicates around 6.8m)
- Gun pressure 2000 psi.
- Single gun NF
Results
Single 250cuin gun G-GunII v. BluePulse 200
| Recording | Gundalf model |
|---|---|
| 8+/-2dB down on G-Gun II at 200Hz | 9+/-1dB down on G-Gun II at 200Hz |
Single 250cuin gun G-GunII v. BluePulse 100
| Recording | Gundalf model |
|---|---|
| 26+/-2dB down on G-Gun II at 200Hz | 30+/-2dB down on G-Gun II at 200Hz |
In both cases Gun periodicities are self-similar with the G-GunII as would be expected from the bubble dynamics.
Clustered sleeve type I guns
Source of data
These data were acquired by Mike Hall of Horizon in the late 1980s. They are high-quality data acquired in a measurement facility in Loch Linnhe in Scotland. A cluster of 2 identical 40 cu.in. sleeve guns was deployed at different separations 0.5m - 2.5m. and the zero - Peak amplitude, zero - Peak primary to bubble and bubble period for these separations.
Data parameters
- Water temperature 5 deg C.
- Filtering - 0/0 - 256/72
- Hydrophone position (0.0, 0.0, 80.0)
- Gun position (0.0, 0.0, 5.0)
- Gun pressure 2000 psi
Signatures
| Gun set up | Modelled and recorded signature parameters |
|---|---|
| 2x40 cu.in. sleeve guns - bubble periods | 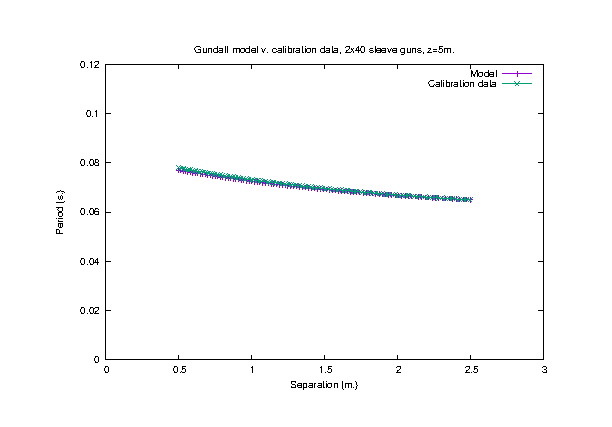 |
| 2x40 cu.in. sleeve guns - zero - peak amplitude | 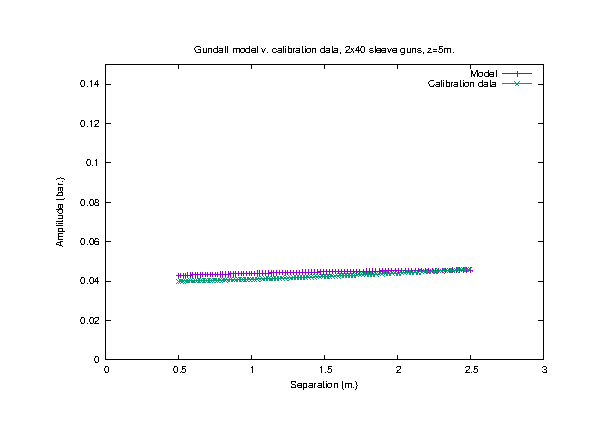 |
| 2x40 cu.in. sleeve guns - zero - peak primary to bubble | 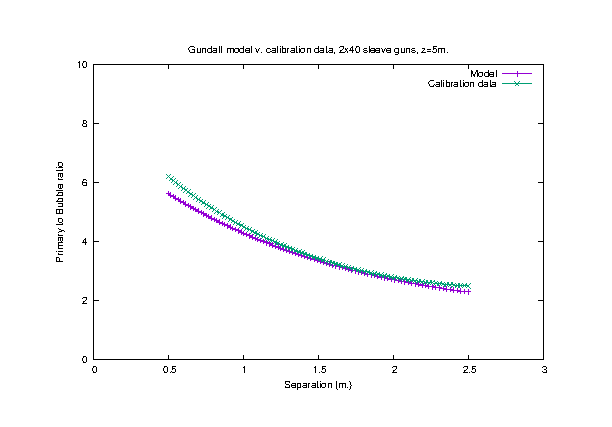 |
Full highly interacting arrays
Introduction
Clustering airguns into groups of 2, 3 or even 4 guns within a metre or so of each other followed directly from the observation that the primary to bubble ratio of a clustered pair of guns grew rapidly as gun separations reduced to a metre or less. This can be seen dramatically in the experiments shown in the previous section, carried out by Mike Hall and Ian Jack in the 1980s and published in Laws, Hatton and Haartsen, (1990) "Computer modelling of clustered airguns", First Break, (8), 9. As two small (40 cu.in.) sleeve guns are brought closer and closer, their primary to bubble ratio increases by a factor of about 2.5.
One other factor intrudes here. It can also be seen that the peak to peak diminishes somewhat. The behaviour of clusters of several guns was revisited in great detail by Sverre Strandenes and Svein Vaage in "Signatures from clustered airguns", (1992), First Break, (10), 8 in which they quantified these effects in a series of careful experiments performed in a specialist facility including high speed underwater cameras. Tbey noted that as more and more air is discharged in the immediate vicinity of an airgun, the ability of the airgun to vent its own air is significantly reduced.
This has become increasingly important today as many arrays rely heavily on interaction for their signature performance and it is necessary therefore that a modelling package handle throttling inhibition correctly. In version 5.1g onwards, Gundalf was adjusted to include this effect using a sophisticated physical model and calibrated from the experiments carried out by Mike Hall and Ian Jack described above from pairs of small sleeve guns. When this was applied to a completely separate array involving a very much larger array of 20 Bolt 8500 APG airguns with total volume 2000 cu.in. in an exceptionally highly interacting configuration measured in a different facility nearly 20 years later, excellent agreement with the measurement was achieved as can be seen below.
This greatly increases the confidence in the physics of the modelling of this effect.
Source of data
These data were supplied by Mike Saunders of Bolt in December 2003. They are high-quality data recorded at a specialist facility. The Gundalf model and recorded far-field signature for a 20 Bolt 8500 APG array of 2000 cu.in. are shown.
Data parameters
- Water temperature 5 deg C.
- Filtering - 3/12-188/325*
- Hydrophone position (0.0, 7.0, 209.0), corrected to bar-m onsite.
- Gun position (0.0, 0.0, 5.35)
- Gun pressure 2116 psi.
(* Simulated - original field filter not available.)
Signatures
| Array type | Modelled and recorded signatures |
|---|---|
| 20x8500 LL (APG), 2000 cu.in., 5m | 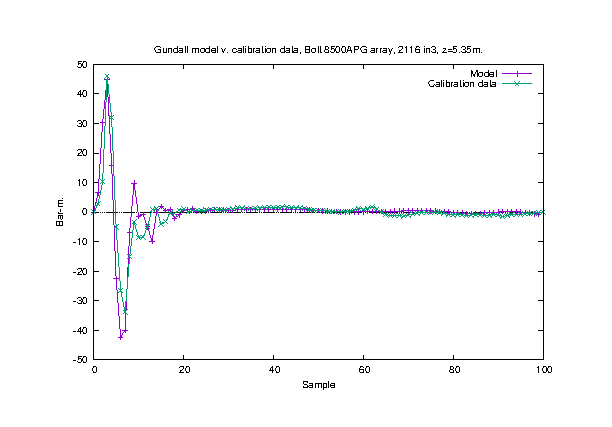 |
High frequency calibration (far-field)
Introduction
In recent years, environmental concerns over the potential impact of airgun acoustic radiation on marine life has become an important issue. One possible area of impact is in the high-frequency output of an airgun array.
Some species, notably odontoceti use kHz bands (somewhere in the region 10-150kHz) for purposes such as echo-location. Until relatively recently, there was no measurement data available for airguns at these high frequencies and no real information available as to their output.
Source of data
These data were kindly made available by the IFRC. They were recorded in the Gulf of Mexico in 2003 and are the first significant dataset out to 40kHz which has been recorded. The peak sensitivity of odontoceti occurs at around 20kHz, so this dataset is particularly important in that it covers this potentially high-impact area, (sensitivity above about 30kHz rapidly decays in these species).
It should be noted that it is very unlikely that kHz frequencies will ever be modelled very accurately as the oscillating bubble is known to be highly anisotropic at these frequencies due to the excessive turbulence and so it is likely that the best that can be achieved will be an idea of the overall background level. This is perfectly adequate at the current level of understanding of the impact of such frequencies on marine life. This has recently been confirmed in the Bolt e500/e300 data referred to in this calibration document which give excellent near-field recordings out to 25kHz.
As can be seen below, the Gundalf model gives an excellent representation of the overall background level and is within +/- 10db even though there remain uncertainties in exact positioning and the local bathymetric propagation properties. (In the absence of any other information, Gundalf here assumes lossless isotropic propagation). For exactitude, the Gundalf model is labelled as filtered simply because any numerical modelling algorithm has a filtering effect. No additional filtering other than that implicit to any finite difference model has been applied. The recorded data is unfiltered other than anti-alias filtering.
Data parameters
- Water temperature 20 deg C.
- Filtering - out
- Hydrophone position approximately 750m down and offset by the same.
- Array volume 3590 cuin deployed at 7m
- Gun pressure 2000 psi.
Signatures
| Recorded Data | 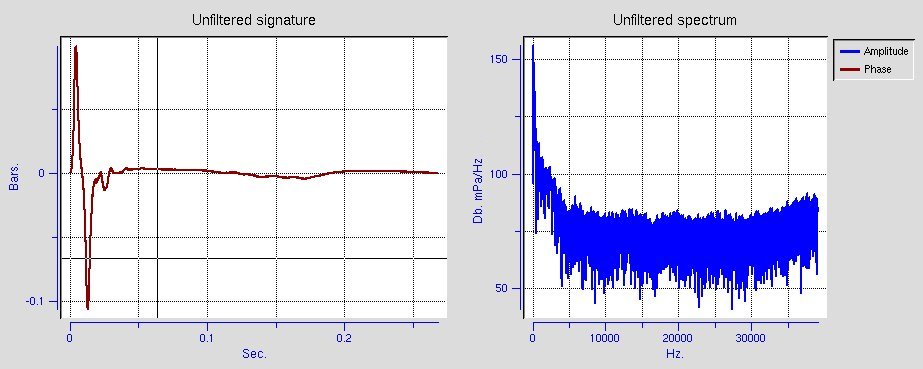 |
| Gundalf model | 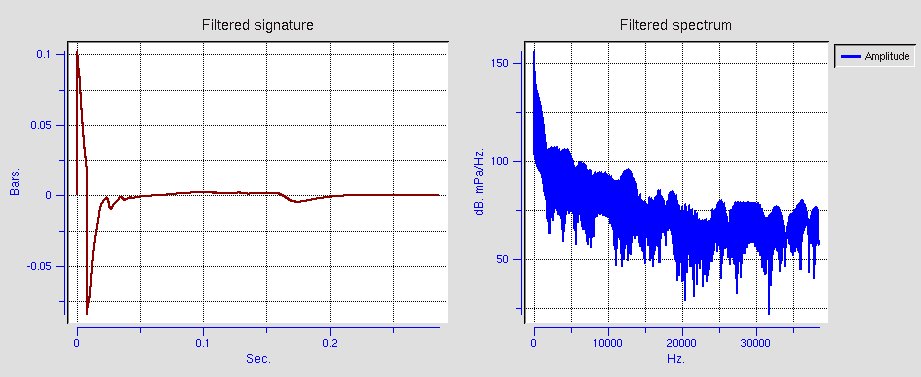 |
Tuned Pulse Source (low-frequency)
Introduction
An important new source aimed at the elusive sub-8Hz part of the source spectrum. Such low frequencies illuminate difficult deep or acoustically hidden targets such as beneath salt domes rather better. It is claimed that these are also more environmentally friendly but this remains to be proven as baleen whales particularly have low-frequency sensitivity but nobody is sure how low this actually goes. It is thought to be 7Hz or perhaps even lower.
Source of data
These data originate from the technical paper by Chelminski et. al. (2021), SEG annual meeting.
Data parameters
- Water temperature Unknown
- Filtering - out
- Hydrophone position - 3 approximately 5m above array but corrected to dB rel to 1 microPa/Hz at 1m.
- Gun position (0.0, 0.0, 10.00) (Ghost indicates 9.7m)
- Gun pressure 1000 psi.
- Reflection coefficient -0.74, (determined by anelastic calculation).
Results
| Recording | Gundalf model |
|---|---|
| 213dB max at 2.8Hz | 213dB max at 2.9Hz |
Gundalf amplitude spectrum
| Array type | Modelled signature |
|---|---|
| 26500 TPS, 1000 cu.in., 10m | 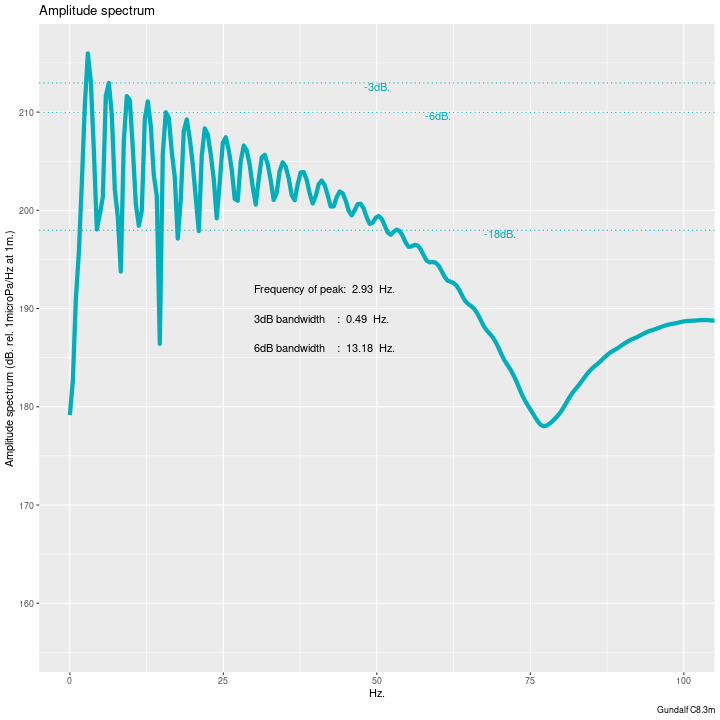 |
Gemini (low-frequency)
Introduction
An important new source aimed at the elusive sub-8Hz part of the source spectrum. Such low frequencies illuminate difficult deep or acoustically hidden targets such as beneath salt domes rather better. It is claimed that these are also more environmentally friendly but this remains to be proven as baleen whales particularly have low-frequency sensitivity but nobody is sure how low this actually goes. It is thought to be 7Hz or perhaps even lower.
Source of data
These data originate from a datasheet by ION.
Data parameters
- Water temperature Unknown
- Filtering - out
- Hydrophone position - Unknown
- Gun position (0.0, 0.0, 8.00) (Ghost indicates 8.12m)
- Gun pressure 2000 psi.
- 1x4000 cuin and 2x4000 cuin.
- Reflection coefficient -0.78, (determined by anelastic calculation).
Results
| Recording | Gundalf model |
|---|---|
| 209dB max at 3.4Hz | 209dB max at 3.9Hz |
Gundalf amplitude spectrum
| Array type | Modelled signature |
|---|---|
| 4000 Gemini, 2000 cu.in., 8m | 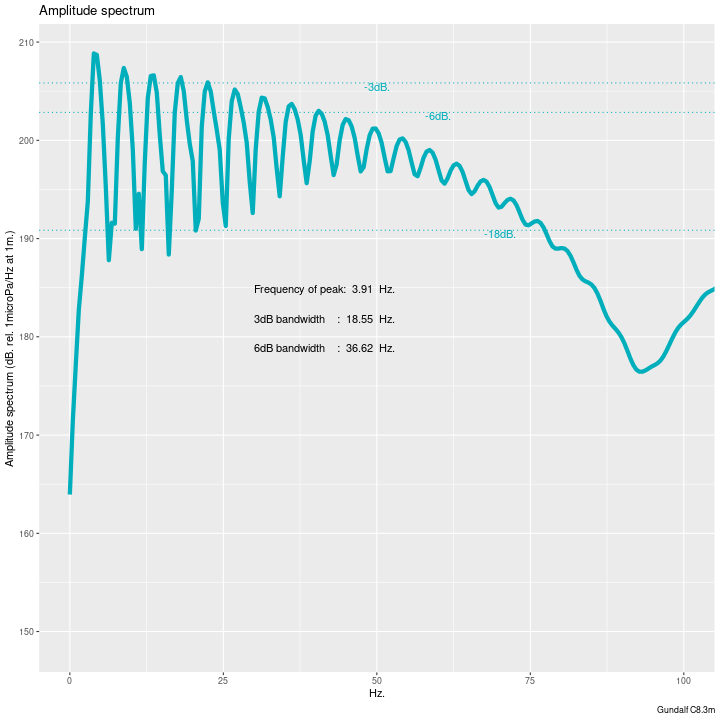 |
| Recording | Gundalf model |
|---|---|
| 214dB max at 4.3Hz | 212dB max at 3.4Hz |
Gundalf amplitude spectrum
| Array type | Modelled signature |
|---|---|
| 2x4000 Gemini, 2000 cu.in., 8m | 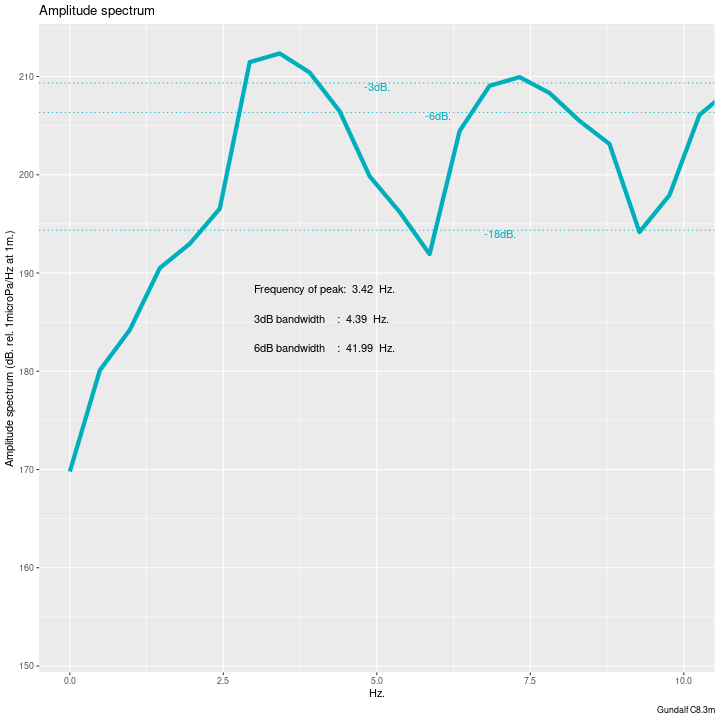 |
Geo-Source and Applied Acoustics
Introduction
Our first attempt at sparker modelling taking account of two different manufacturers. In both cases, all information has been gathered from data sheets produced by the corresponding manufacturer. Initial impressions show that the generic cavity model we use gives reasonable zero to peak estimates and places the spectral peak in roughly the right place, (somewhere above 1kHz). Sparker modelling is inherently a little more difficult than airgun modelling primarily because the source is much closer to the free surface (perhaps as little as 15-20cm), compared with airguns which are usually deployed from at least 3m deep. However, the sparker can still output of the order of 1-2 bar-m, comparable with a single airgun and this is enough to disrupt the surface anelastically. As such we recommend that the user let Gundalf calculate the anelastic reflection coefficient.
Sparker sources are rated by number of tips which can vary from perhaps as low as 10 up to several thousand. Calibration data is not sufficient to use number of tips as a modelling parameter, so we have done it purely by stated output in the corresponding datasheet.
Source of data
These data originate from datasheets by both manufacturers.
Data parameters
- Water temperature Unknown
- Filtering - out
- Hydrophone position - Unknown
- Gun position (0.0, 0.0, 0.20m and perhaps deeper)
- Gun pressure N/A
- Reflection coefficient -0.3?, (estimated by anelastic calculation).
All dB are re 1microPa at 1m. Sometimes data sheets use bar-m. All sparkers modelled at nominal 0.2m depth except the UHD400, lower-deck only, which has been modelled at 0.4m.
Results
| Array type | Measured/Model peak | Measured/Model Spectral peak |
|---|---|---|
| Geo-Source 200LW, 300J | 0.9bar-m/0.9bar-m | 1300Hz/1320Hz |
| Geo-Source 400LW, 4000J | 2.9bar-m/2.7bar-m | ?/1310Hz |
| Geo-Source 800LW, 6000J | 2.8bar-m/2.6bar-m | ?/1500Hz |
| Geo-Source 1600LW, 16000J | ?/5.1bar-m | ?/1589Hz |
| AA Delta sparker, 6000J | 226dB/226dB | ?/1767Hz |
| AA Dura-Spark L80 sparker, 200J | 221dB/221dB | ?/1310Hz |
| AA Dura-Spark L200 sparker, 500J | 222dB/222dB | ?/1308Hz |
| AA Dura-Spark UHD400 sparker, 600J | 226dB/224dB | ?/1377Hz |
| AA Dura-Spark UHD sparker, 2000J | 226dB/225dB | ?/1258Hz |